Pages

Sunday, February 28, 2010

AN ALL-TIME HIGH FOR GOLD

Another month goes by, and another new all-time high for gold. At least for Europeans...

Longtime DailyWealth readers know we encourage everyone to view the world the way a rich, global investor does: through several different "lenses."

One way to look at world currencies is through the "lens" of gold. This gives you insight into what's happening beyond your own borders.

For instance, gold, in dollar terms, is well off its December highs. But in terms of the plummeting euro, gold reached a fresh all-time high this month. Chris Weber's brilliant "Currency Trade of the Millennium" is playing out in grand fashion.

The Crowd Is About to Get Destroyed in Currency Trading

Several weeks ago, I was invited to a client meeting in Miami held by the wealth-management firm AllianceBernstein.

Bernstein's investment research has long been regarded as the best on Wall Street.

Why? Bernstein does honest, thorough work because it doesn't engage in investment banking. It's paid to be right, not to sell retail clients down the river to pull off a public stock offering or sell a bond.

In Miami, the firm's head economist spoke about the dynamics of the global currency markets and explained AllianceBernstein's trading strategy. It borrows in four to six currencies with low interest rates and buys four to six currencies with higher interest rates. This diversified approach reduces risk substantially. And it has historically produced better average returns than the S&P 500 with less volatility.

The presentation was designed to entice wealthy U.S. investors to open leveraged foreign-exchange trading accounts with AllianceBernstein. And I must say, the presentation was among the most sophisticated I've ever seen. The economist really knew his stuff. But... I was deeply troubled by the presentation.

In my experience, whatever the big brokers are pitching to retail clients, that's the thing most likely to blow up next. One year it's dot-com stocks, one year it's mortgage backed securities, one year it's commodity futures, and so on...

I'd never seen a Wall Street firm give a leveraged currency presentation to retail clients before. While this kind of trading can be very profitable, it is extremely risky – especially right now.

For the first time since just after World War I, we have serious sovereign debt problems in all of the major currencies. And for the first time in the history of man... we have a global monetary base that's not anchored to any real asset.

In fact, the largest reserve assets of the world's monetary system are the obligations of a bankrupt nation (the U.S.) that must print money to afford its own annual deficits (read my essay on this here).

This is a recipe for disaster.

I believe the entire system of paper money – globally – is coming unglued. The result will be a kind of volatility and disruption to the global economy the world hasn't seen since World War I, when the gold standard ended in 1914.

Ironically... ignorant of these enormous risks... retail investors are running full speed ahead into foreign-exchange trading.

Deutsche Bank reports its currency trading platform for retail clients saw a 40% increase in customers during 2009. In the U.S., foreign-exchange volume was up 28% last year – almost entirely because of retail trading.

I suspect these numbers will continue to grow for a while, but I urge you to avoid this looming disaster. It will be devastating to unsophisticated traders who don't practice sound position sizing and don't use stop losses.

While trading foreign currencies has been a good strategy for a long time... what will happen to those strategies as volatility soars and the large currencies collapse? No one knows.

But one thing I do know for sure: It won't end well for retail investors. Someone has to hold the bag for all of the world's paper money. Who do you think will end up holding the bag? Retail investors... or giant institutions like AllianceBernstein?

My advice for anyone itching for a currency trade: Trade worthless paper dollars for gold bullion. Trade them for silver. Repeat as often as possible.

India is in the race to own the world

A few weeks ago we noted the world's largest coal producer, Coal India, was on the hunt for global assets to expand their reach. It appears this is now part of a broader national strategy mimicking what China has been doing the past half decade+.

If you have any Malthusian bones in your body, you have to wonder as certain countries waste all their national treasure on bailing out banks, financing the lifestyles of those who refuse to save for themselves, and funding pet projects of their politicians - while others are attempting to snatch up as many long lived assets across the globe, what the long term implications will be.

THIS IMPORTANT MARKET NOW LOOKS "TOPPY"

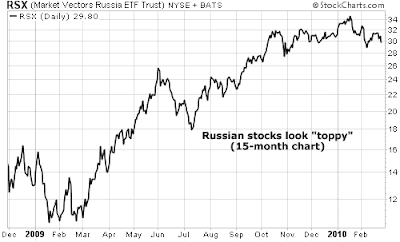
Traders take note: Russian stocks – one of our favorite gauges of risk appetite – are struggling right now.

Seasoned traders see Russia like this: It's the largest country in the world... and blessed with incredible deposits of oil, natural gas, nickel, gold, timber, and diamonds. Those are the major "pros." The major "cons," however, are literally major cons. Most anyone who does business in Russia will tell you the government is as crooked as a dog's hind leg. This introduces tremendous risk to an investment or trading position.

This "lots of valuable resources, lots of risk" situation makes Russia boom and bust like crazy. Russian stocks skyrocketed more than 500% from 2003 to 2008. Then, during the credit crisis, they turned around and lost 80% of their value. In 2009, they staged another incredible rally and tripled off their lows.

But as you can see from today's chart, this rally is now stuck in the mud. Russian stocks, as represented by the Market Vectors Russia fund (RSX), have moved sideways since October. It has failed twice to eclipse its January high. The fund is also sporting massive trading volume on declining days and flimsy volume on advancing days. The "risk players" have had their fun and are now bailing.

Saturday, February 27, 2010

The Recession Is Most Certainly Over

"There are still no jobs here," my friend Lee tells me.

Lee used to work for a beachfront resort on Florida's east coast. Our town was built on tourism and real estate. Both are dead. The resort is on the brink of bankruptcy.

I told you Lee's story a few months ago in DailyWealth. The situation isn't any better today. I lent him some money recently... which I know I might not see again.

Officially, Florida's unemployment rate is 12%. But unofficially, it has to be much worse... When 20% of Palm Beach County residents are 90 days or more behind on their mortgage (as I wrote about in DailyWealth here), something is going terribly wrong.

With all this terrible news in Florida, what I'm about to say might sound crazy to you. But I believe it is true: The recession is most certainly over. In fact, the more likely scenario is a boom.

Let me show you why with one simple indicator...

The indicator is the "yield curve." And it's saying there's definitely no risk of recession now.

The "yield curve" is a simple idea. A "normal" yield curve simply shows that if you want to borrow money for a year, the interest rate is lower than if you want to borrow money for 10 years. That's "normal" because it's riskier to lend someone money for 10 years than one year... so you demand a higher rate of interest for a 10-year loan.

Normally, the difference between long-term interest rates and short-term interest rates is about one percentage point. That's what it's averaged over the last 50 years. So when interest rates on 10-year government bonds are at 4%, as they are now, then interest rates on one-year bonds should be 3%.

So that's normal. But when the government – the Federal Reserve, actually – tries to steer the economy, it makes a mess of "normal." And when it does, recessions ALWAYS follow.

For example, if the Fed wanted to slow the economy down today, it would raise short-term interest rates over 4%. That would upset the natural order of things. It would make it expensive and difficult for banks and businesses to make money. It would lead to recession.

The chart on this page shows it... when the blue line drops below zero, it means the Federal Reserve raised short-term interest rates above long-term interest rates.

In every single instance in the last 50 years (except for one in 1966), a recession follows. (Economic growth fell to zero in the second quarter of 1967, so a stealth recession happened in that case as well.)


When you think about it, you could say the Federal Reserve actually causes recessions, by forcing short-term interest rates to a painfully high level.

That's what it did in 2006/2007. The yield curve was "inverted." Short-term interest rates were above long-term rates. And then the Great Recession hit.

Now the Federal Reserve is doing the opposite... It has cut short-term interest rates to artificially low levels again. The "yield spread" is now as wide as it's been at any time in the last 50 years, as the chart shows.

It is the recipe for another boom. The Fed is artificially creating a boom. That boom, of course, will end when the Fed raises rates too high someday down the road, and the cycle begins again.

So the Fed artificially pushing interest rates too high is our signal a recession is coming. We're definitely not there yet. According to this indicator, the bigger risk going forward is a great boom, rather than a "double-dip" recession like many are calling for.

Times feel really tough out there. I know it. I live on the coast of Florida, Ground Zero of the housing bust and the subsequent economic bust.

But I strongly believe the worst is over. One reason is the yield curve. This indicator has a fantastic track record. It's saying we're not headed into another "dip." It's saying there's a boom ahead.

Friday, February 26, 2010

Jim Rogers: China will keep dumping U.S. Treasuries

China will continue to sell U.S. Treasuries in the future, says Jim Rogers, co-founder of the Quantum Fund.

China will unload more debt as the “euro scare” continues, he said.

The government reported that appetite for Treasuries declined by the largest amount in December as China reduced its allocation by $34.2 billion to $755.4 billion. Japan made a similar move and lowered its amount by $11.5 billion to $768.8 billion.

HOW TO JUDGE THE "HALF FULL VS. HALF EMPTY" DEBATE

The great guru debate right now: Is the economy in a real recovery, and is a decent job market on the way back? Or are high-profile bears like Harvard's Ken Rogoff right? Are new debt "shockwaves" set to rock everything?

As always, let's consult the market... and let's mind a huge potential "1-2-3 trend change."

Bulls need the uptrends in companies like Darden Restaurants and Home Depot to remain intact. These uptrends tell us the government's E-Z-Credit program is keeping the consumer and the banking industry afloat. If the uptrends suffer severe breakdowns, we'll know the negative effects of the credit bubble are still with us.

And don't forget to watch copper as a "must hold" asset for the inflationary bullish case. Copper is an essential ingredient in cars, refrigerators, power lines, and electronics. However the economy is performing – good, bad, ugly – you'll see it reflected in copper prices. As you can see from the chart below, copper suffered a major decline in late January/early February (1). It has since made an effort to climb back to its old high, which failed (2).

We now have a situation where copper is set up for a classic Vic Sperandeo 1-2-3 trend change, just like the euro experienced in December. If copper turns lower – and blows through its recent low around $2.85 per pound (3) – the E-Z-Credit stimulus boom is withering.

The Toyota recall story you haven't heard

In case you haven't heard, Toyota is in trouble with the Feds. But not because of anything it did or didn't do.

The House Committee on Oversight and Government Reform is demanding the president of the company sit under its klieg lights and explain himself. Committee leaders are going to bully him with the threat of legal action until he shows up.

Politicians know they can get a lot of free press by stoking the popular perception that Toyota somehow knew the gas pedals were "dangerous," but installed them anyway, violating U.S. laws and regulations.

This is utter nonsense, though you can be sure the U.S. automakers are doing everything to encourage this hysteria.

When I heard the news about the gas pedals getting stuck and causing fatal crashes, I had to think about the probability these accidents resulted from the use of an ill-designed component.

Consider the numbers: 34 people died in accidents blamed on the pedals. That's a pretty small number, but maybe enough to raise some concerns... until you realize that's the total number of fatalities since 2000.

Toyota has recalled more than 8.5 million vehicles in the U.S. Assume the owners drive those vehicles 10,000 miles a year (12,000 is probably more accurate, but 10,000 is a conservative estimate... and a factor of 10 makes the math simpler). That means Toyotas are logging more than 85 billion miles a year in the U.S. - 850 billion miles during the last 10 years.

So divide 34 deaths into 850 billion miles, and the odds of a Toyota owner having one of these accidents is one in 2.5 million... That's a random event.

If Toyota were using faulty equipment, we would have seen thousands more accidents and deaths.

You're more likely to get killed by lightning: 60 people died from lightning in the U.S. just last year. Heck, I'm more likely to get a hole-in-one on the golf course. The odds of that are only 5,000 to 1.

But statistics aside, just apply a little common sense to the question. The allegedly defective accelerator part is made in Canada by Indiana-based CTS Corp. Many makes and models use this same part. For example, the Pontiac Vibe uses it. Ford sells a van in China with the component.

Why aren't we hearing about those cars? None of the drivers with American cars that use identical parts ever experienced a stuck accelerator? It just makes no sense.

But never mind... The demagogues know a vote-getter when they see one. Transportation Secretary Ray LaHood told people to stop driving Toyotas... and then retracted it saying it was "obviously a misstatement."

I'm confident those parts are safe. Still, if you drive a recalled Toyota, you should take it in to get the pedal replaced. Ignoring the recall could void your warranty.

And look for Toyota stock to be one of the great buys of the decade, too...

Thursday, February 25, 2010

Greece now cutting its own throat

The conversations about the Greek debt load and deficit focus almost exclusively on programs to get the nation to cut costs in order to balance its budget. That leaves out the revenue and receipts part of the ledger.

The Greeks are in danger of making their financial situation much worse due to a series of strikes which seem to get larger by the day. According to the BBC, “Hundreds of thousands of Greeks are on strike to protest at the imposition of austerity measures to save the economy.” One of the effects of the labor stoppage is that Greece’s national transportation network is virtually shut down.

Euro set to fall off a cliff

Economist and money manager Gary Shilling says the euro is likely to drop about 27 percent from current levels.

“I think the currency could go back to 1-to-1 versus the dollar,” he says.

“The problem is that Europe has a one-size-fits-all monetary policy but very different fiscal statuses in individual countries.

Wednesday, February 24, 2010

NO SURPRISE FOR THE POUND, BILL GROSS IS RIGHT


The message from today's chart: Bill Gross 1, British politicians 0.

About three weeks ago, we profiled the downside "breakout" in the British pound. Investing legend Bill Gross said Britain's government bonds (and therefore, its currency) were "resting on a bed of nitroglycerin," made of debt and malinvestment. British politicians publicly disagreed with Gross and assured the public that the government's finances are going to be fine.

The chart below displays the past year's trading in the British pound. As you can see, the market is taking Gross' side on this one. The red arrow marks our first "look out below" warning. This is when the pound hit its lowest point in four months. The currency then staged a flimsy relief rally, which fizzled. And in the past week, the pound just struck another new low (blue arrow).

In a world of runaway government bailouts and handouts, expect this kind of weakness to hit almost all paper currencies. And while the best traders can profit in the currency markets, the "sleep well at night" action here is to take a position in the only honest money around – gold.

Tuesday, February 23, 2010

Tiny Oil Stock Making Mysterious 200% Jumps

A stock promotion just landed on my desk...

According to the promotion, the U.S. Geological Survey has just announced an enormous oil discovery. This oil discovery straddles the U.S. and Canadian border above North Dakota in an area called the Williston Basin. The USGS says the discovery contains 503 billion barrels of oil, worth $37.7 trillion at current prices.

"It's a literal ocean of oil," says the copy.

JayHawk Energy is a tiny oil company that owns five oil wells in the center of this discovery. According to the promo, JayHawk bought these wells a year ago, before anyone knew there was an "ocean" of oil there. Then the USGS released their report. JayHawk Energy suddenly finds itself sitting on a fortune...

"Every share of JYHW you buy today could skyrocket as much as 1,200% in the next 24 months," the promo says. "Buy JYHW – don't wait any longer."

Do I think you should put your money in JayHawk? Absolutely not!

Many times, in situations like this, stock promoters have taken a large position in whatever stock they are touting. Now, they want to sell their stake. So they're mailing this aggressive promotion to thousands of investors, hoping to push JayHawk's stock price up.

Here's the chart of JayHawk Energy. You can see they probably started mailing this promo in November 2009. Notice the spikes in January and June 2009. The promoters probably generated those spikes, too.

JayHawk is up 1,200% since January 2009. The promotion has worked. So now the promoters will likely sell their stock and find a new target. JayHawk's stock is probably about to collapse.

You might be surprised to hear this, but I don't have a problem with stock promotions like this. Not only are they 100% legal, but if you read the tiny print on the back page, the promoters tell you how much they paid to distribute the ad ($400,000) and how many shares of JayHawk they own (500,000).

"We're generating investor awareness," they say.

The investment markets are fraught with traps like this. They disguise the trap as investment advice, but they really just want you to buy whatever they're selling. Most traps are much harder to spot than this one. Take Wall Street investment banks, for instance. They use bullish research reports to cement lucrative investment banking relationships. Brokers use "buy" recommendations when they need to distribute stock. You should even ignore most advice from fund managers. They only mention stocks they have big profits in. They need your buying interest to liquidate their positions at good prices.

To be a successful investor, you must be able to distinguish biased research from independent research. The easiest way to do this is to ask "does the advisor stand to gain if I follow his advice?"

If the promoter is a Wall Street investment bank, for example, the answer is "yes," meaning you shouldn't pay any attention to the proponent's opinion. Their data might be useful, but their conclusions are worthless.

If the answer is "no," then you know the advisor has his reputation on the line. You can take this source seriously. This advisor has a major incentive to be right.

What about the advice we offer in DailyWealth? We don't have any financial interest in the stocks we cover. But we do have our reputations on the line. If we're boring, inaccurate, or wrong, then you'll stop reading and we'll lose our jobs. So giving valuable advice is the only thing that matters to us.

In sum, always stay alert for stock market traps like this JayHawk Energy situation. They're part of the business. Learn to recognize them and avoid them. If you need advice, only accept independent research where the advisor has an incentive to provide you with quality information.

Monday, February 22, 2010

THE BIGGEST NUMBER IN THE WORLD


Our chart of the week is an update on one of the most important "must watch" numbers in the world... the yield on the 10-Year U.S. Treasury note.

The 10-year yield is the most commonly tracked gauge of how much Uncle Sam must pay creditors to borrow money. A rising yield indicates creditors are demanding higher rates to compensate them for the risks of loaning money to the sovereign equivalent of a 15-year-old with daddy's credit card. A falling yield indicates a sluggish economy and no worries about inflation or the creditworthiness of the U.S.

Some analysts, like our colleague Porter Stansberry, believe our creditors will demand much higher rates of interest soon... rather than the current 3.82% yield.

As you can see from this week's chart, the 10-year yield just jumped toward a new 12-month high... and is close to an upside breakout over 4%. If this breakout happens, it's the market saying, "Yes, Porter is right. Creditors are requiring more yield... and I'm sending rates higher."

Sunday, February 21, 2010

The Most Important Chart in the World Right Now

To most people, any talk of the U.S. government debt simply doesn't mean anything.

For instance, I could tell you the annual funding costs of our national debt are approaching $4 trillion per year – that's $1.5 trillion in new annual deficits, plus $2 trillion-$3 trillion a year in short-term obligations coming due that need to be refinanced. Foreigners hold roughly half of this debt. Thus, we have about $2 trillion in foreign debt that must be repaid or refinanced each year.

But this obligation is so large that it's meaningless to most people. I could also tell you $2 trillion is 20% of our GDP, but even then, most people won't understand just how much money this is. So think of it this way...

If you spent $1 million per day from the time of the founding of Rome – roughly 2,700 years ago – until today, you would have accumulated about $1 trillion in debt. Now, double that amount. And that's the size of our annual foreign borrowing obligation.

(Thanks to Eric Margolis for the trillion-dollar metaphor. See his essay "Spending America Into Ruin" here.)

But more important than understanding the size of this debt, it's vital that you understand its effects. In this essay, I'll show you the easiest way to track those effects... and the actions you must take to protect yourself from them.

The Barclays iShares 20+ Year Treasury ETF (TLT) tracks the value of the U.S. government long-bond market. This is the primary market the Fed was trying to support over the last year. Gold, on the other hand, is the best market-based judge of the soundness of the U.S. dollar and our creditors. The SPDR Gold Shares ETF (GLD) is an accurate proxy for the price of gold.

Look what happened to U.S. bonds (TLT) and gold (GLD) over the past year. This occurred even as the Fed was massively intervening in the credit markets.

Note the value of the U.S. long-bond market fell by more than 10% despite the government support. And the value of gold increased by more than 10% as investors fled the dollar.

It's interesting the relative moves were nearly identical. There's no free lunch. For every penny the government prints or borrows and uses to manipulate long-term interest rates, that same penny is being taken out of the value of the U.S. dollar, as is revealed in the price of gold.

You will see lots of debates about what the coming currency crisis means. But if you can simply understand this chart, you will grasp what's happening and how to protect yourself. It's simple: The value of the dollar is collapsing as the un-creditworthiness of the United States becomes evident. That means the price of hard assets – like gold – will keep rising and the value our government's long-term obligations will fall.

The safest thing to do right now is split your savings between short-term Treasuries and gold. That's the equivalent of a "cash" position, as the gold will hedge your dollar exposure and the short-term Treasuries will mitigate the volatility of gold. You can do this through ETFs. The Barclay's iShares 1-3 Year Treasury ETF is an easy way to own short-term Treasuries. The symbol is SHY. And GLD is the most liquid gold ETF.

I personally hold my gold in bullion coins and recommend you do the same. It's better and safer than the ETF. But for lots of people, the ETF is simply more convenient.

However you decide to take a position in gold, do it soon. I expect the divergence you see above – of U.S. debt decreasing in value, while gold increases in value – to get much bigger in the coming years.

Saturday, February 20, 2010

How I'm Betting Against the Euro

Two months ago, I recommended betting against the euro...

It was my top idea. The entire issue of my True Wealth newsletter two months ago was dedicated to that idea. And in last month's issue of True Wealth, I said it was my "top recommendation."

Most Americans have no clue that in Nevada there's a secret residents have been using for years to help them grow rich, and stay rich, well into retirement.

In short, it's an opportunity that enables ordinary Americans to collect lucrative financial "royalties" several times a year. The Washington Post reports, "No [opportunity of its kind] in the United States promises more future riches..."

Here's exactly what I wrote two months ago:

This type of opportunity doesn't come along very often. It is time to bet against the euro. It is overpriced. The euro is in a horrible situation right now. A mountain of factors is against it. And in just the last three weeks or so, a downtrend has been established – so it's time to make the trade.

My friend, the euro is crashing...

At the beginning of December, it cost $1.50 to buy one euro. Six weeks ago, it was at $1.45. As I write, it is at $1.36. It doesn't sound like much, but a 9%-plus drop for a major currency in two months is big.

And my subscribers have done well... particularly since I recommended a "double-inverse" fund, which is an investment that gains 2% for every 1% fall in the euro. Specifically, we bought shares of the ProShares UltraShort Euro Fund (EUO). Below is a six-month chart. Take a look at how it's done since December...

And the reality is, the current problems in Europe are not going away. In the Wednesday edition of the excellent Gartman Letter, Dennis Gartman said he is convinced "we are watching the first battles in a long war that shall end with the dissolution of the European Union and the European Monetary Union."

Then on Thursday, he made another great point: Let's say you run the government in China or India, and you've been diversifying your reserves outside of the dollar and into euros. Now the euro is in danger of breaking apart. What would you do? Would you hold your euros and hope? Or begin a hasty exit? The choice is clear: "Sell... and sell what you can," Gartman says.

Gartman points out that the cultural differences between Greece and Germany, for example, or Ireland and the Czech Republic, are simply too vast. Europe is not America... From California to Virginia, Americans have common ground, common culture. That's just not so in Europe. It was only a matter of time before these differences would surface and things would come to a head... That time is arriving now.

In short, uncertainty will hang over Europe now for a very long time. And investment markets hate uncertainty. So the euro's prospects are dim.

One thing, though: The world is finally catching on... We're seeing a huge number of traders betting against the euro right now. I expect we'll see a strong bounce in the euro kick many of these traders out of the trade... Many currency traders use extreme leverage, so it won't take a lot for them to have to cover their positions. A bounce up to $1.40 or so in the euro should do it.

But I have no intention of exiting our trade. A bounce to $1.40 is nothing... it's about a 3% rise – which would mean a loss of 6% on our double-inverse fund (EUO). That's a loss I'm willing to risk. The euro has farther to fall.

It's still time to bet against it...

Friday, February 19, 2010

The best currency trade in the world right now...

Two months ago, I recommended betting against the euro...

It was my top idea. The entire issue of my True Wealth newsletter two months ago was dedicated to that idea. And in last month's issue of True Wealth, I said it was my "top recommendation."

Here's exactly what I wrote two months ago:

This type of opportunity doesn't come along very often. It is time to bet against the euro. It is overpriced. The euro is in a horrible situation right now. A mountain of factors is against it. And in just the last three weeks or so, a downtrend has been established – so it's time to make the trade.

My friend, the euro is crashing...

Dollar soars overnight on surprise rate increase by Federal Reserve

The Fed has been talking about its "exit strategy" for quite some time. Few believed he would pull the trigger on anything soon. Yet, Bernanke, unexpectedly raised the discount rate headed into options expiration.

THIS CHART PROVES THE AMERICAN DREAM LIVES


The "American dream" lives. Note today's chart, which shows the new yearly high in Home Depot (HD)...

Home Depot is one of our favorite "real world" indicator companies. As the country's largest home improvement chain, HD's stock rises and falls with America's ability to spend money on new flooring, kitchens, bathrooms, windows, and lawn ornaments. Since the American dream is to own a home, HD's earnings and share price are great indicators of how things are going economically.

Obviously, things are "going" right now. The government's giant E-Z-Credit program has businesses and consumers floating on an ocean of cheap money. This has offset the dampening effects of the housing crash and high unemployment.

How will this all turn out? As we often remind folks, there ain't no such thing as a free lunch. Paying for all kinds of bailouts, clunkers, subsidized home loans, food stamps, sport wars, and welfare checks will eventually debase the paper dollar. But for now, Home Depot and its customers are riding comfortably on the Fed's gravy train.

Thursday, February 18, 2010

Dollar rallies strongly today

We want to draw your attention to today's dollar rally.

The dollar fell hard yesterday as stocks rallied, but it quickly regained those losses today and looks to be headed to new highs.

Strength in the dollar has preceeded losses in stocks so far this year, so traders should be prepared for the possibility of more market weakness in coming days.

George Soros just bought a lot of gold

George Soros's Soros Fund Management charged into gold during the fourth quarter, doubling its stake in the world's largest gold ETF.

Note that he did this despite the fact that gold prices had already run up substantially by 4Q.

AS PREDICTED, GOLD STOCKS "POPPED" HIGHER


As usual, Jeff Clark was right about buying gold stocks.

About three weeks ago, we noted gold stocks had suffered much more than the average sector during the January decline. This suffering took the golds to a badly "oversold" level... a level we showed often precedes major rallies.

A reminder: Markets move in waves. While these waves are impossible to accurately predict, they do have a tendency to stage "rubber band" snapbacks after big moves. As you can see from today's chart, the big gold stock fund (GDX) just enjoyed one of those snapbacks... which Jeff's readers traded for 100% gains.

We typically cover longer-term ideas in DailyWealth. But we also know going against crowd behavior – and trading overbought/oversold extremes – is a great way to make money for folks with time to follow day-to-day movements. And as this trade reminds us, it's well worth it to take Jeff Clark's "day-to-day" advice.

Wednesday, February 17, 2010

HOW EUROPEANS SEE THE PRICE OF GOLD


Last week, we covered how rich investors tend to see the price of gold: with the "long view" in mind. Today, we see gold through another rich investor's perspective: the global one.

You see, sophisticated investors tend to look at the world through a variety of lenses. Something that seems horrible to a U.S. investor might be great for an Australian or Chinese investor. For instance, a currency crash in one country means an investor in a country with a strong currency can buy assets – or travel – on the cheap. More perspectives mean more opportunities.

Today, we look at gold from a European's perspective. Gold in terms of U.S. dollars is down more than $100 an ounce from its December high. But as you can see from today's chart, gold priced in euro terms is just a whisker away from a new bull-market high. The global trend of junk paper currencies falling and gold rising continues.

Saturday, February 13, 2010

A PICTURE OF U.S. REAL ESTATE

Our chart of the week displays an asset we consider one of the best barometers of the U.S. real estate market... a share of stock in St. Joe Company (JOE).

St. Joe is a huge real estate developer. With nearly 600,000 acres of Florida land, it's one of the largest private landowners in the country... so its share price tends to rise and fall with investor sentiment toward U.S. real estate.

As you'd expect, shares have done a lot more "falling" than "rising" in the past several years. JOE fell more than 80% from mid-2005 to last year's market bottom. But over the past year, JOE has put together a series of higher highs and higher lows. JOE's "California cousin," Tejon Ranch (TRC), sports a similar uptrend.

JOE's new recovery is no cause to expect rising real estate prices. It's simply a sign things are "less bad" in real estate than they were a few years ago.

HERE'S WHY FREEDOM WORKS!


Singapore is acting just like a "trophy asset" should right now...

Several months ago, we covered how sophisticated investors always track world-class "trophy assets"... the impossible-to-replace real estate, brand names, infrastructure assets, and resource deposits of the world. Buying these assets at the right price is one of the surest ways to get wealthy through investing.

We consider the city-state of Singapore to be one of these trophies. Singapore sits at the center of the booming East Asia/Australia region. It's currently No. 4 in MasterCard's world financial-center rankings. It's home to the world's largest water port. Most importantly, it's considered the world's easiest place to set up and conduct business. All of this creates a powerful tailwind for Singapore investments and prosperity.

For a picture of this tailwind, let's look at the past year's trading in the iShares Singapore (EWS), a basket of Singaporean stocks. While the high-debt, high-tax, high-regulation economies and stock markets of Europe have suffered major declines in the past month, Singapore's market has declined just a few points. This trend of "Asia up, Europe not-so-much" is going to last the rest of your life.

Friday, February 12, 2010

Why the Greek debt crisis matters to US investors

Yesterday we presented our views on why Europe's decision to tip over the first of the bailout dominoes will be inherently a catastrophic one in the long term, and will ultimately transfer the peripheral liquidity risk into funding, and ultimately, solvency risk to the very core.

Today, Niall Ferguson joins in, in this latest Op-Ed in the Financial Times.

"It began in Athens. It is spreading to Lisbon and Madrid. But it would be a grave mistake to assume that the sovereign debt crisis that is unfolding will remain confined to the weaker eurozone economies. For this is more than just a Mediterranean problem with a farmyard acronym. It is a fiscal crisis of the western world. Its ramifications are far more profound than most investors currently appreciate."

OUR BARGAIN PRICE FOR GOLD


So… we've got $11-$12 pegged as the rich man's "bargain price" for his silver insurance. What about gold? Where does the rich man step in to buy during a gold decline?

Well, the rich investor tends to look at things from the "long view." He thinks in terms of years, not months. So let's consult the long view of gold to find the bargain price for the ultimate financial insurance.

Below is the past five years of the bull market in gold. As you can see, gold tends to jump $200-$300 per ounce when it makes a leg higher. It then declines and moves sideways for months and months. This decline and sideways action serves to shake out and frustrate as many people as possible.

Just five months ago, gold kicked off an incredible $250-an-ounce move that took it above $1,200 an ounce. Its natural decline from this high has all kinds of finance people wetting themselves and grasping for answers. The rich man doesn't panic. He keeps a chart like this in mind and knows gold could fall down below $900 and still remain in the confines of a bull market. He buys more.

Thursday, February 11, 2010

Dr. Doom Roubini: Dollar rally ending

The dollar’s recent rally, which has taken it to a six-month high, will soon fade against Asian and commodity currencies, says star economist Nouriel Roubini.

Commodity currencies include the Brazilian real, Canadian dollar and Australian dollar.
He anticipates a 15 percent to 20 percent drop by the greenback against these currencies in the next two to three years.

THIS MONSTER DOWNTREND IS NOW "EXHAUSTED"


A question comes into DailyWealth: OK... so the "China bears" are now in control. How can I make money here?

Answer: Take a look at the short China fund. It's displaying some classic "trend exhaustion."

Below is the past 15 months of trading in the short China fund (FXP). This fund declines when Chinese stocks rise and rises when Chinese stocks decline. As you can see, this fund suffered a monster downtrend as Chinese stocks rallied in 2009. FXP falls when Chinese stocks rise, and it fell from over $180 per share to less than $8.

Stocks and funds that have gotten this beaten down make some of the world's greatest trading vehicles. Even the strongest trends (down or up) "get sick." They get old and exhausted. When an asset is this depressed, it takes just a bit of "less bad" conditions to kick off a 50% rally. And as our colleague Jeff Clark noted in this brilliant essay, it can also create big opportunities for income investors...

Wednesday, February 10, 2010

China is buying up the world

It’s no secret that China is the world’s largest commodity buyer, but it’s now clear they intend to own the world’s commodity producers, too.

A recent SEC filing has revealed that China Investment Corp., China’s massive $200 billion sovereign wealth fund, has been buying up large chunks of several resource companies, including potash, base-metals, and gold mining companies.

The detailed filing shows the fund has spent billions on mining and energy companies such as Kinross Gold, Potash Corp., Teck Resources, Vale SA, Freeport-McMoRan, and ArcelorMittal. The fund also owns $155 million in shares of GLD, the gold ETF.

Tuesday, February 9, 2010

INCREDIBLE PRICE ACTION IN COPPER


Traders take note: Copper just "jumped out the window."

There's a classic Wall Street saying that goes, "The bull walks up the stairs and the bear jumps out the window." Bull markets tend to march higher and higher as money required to boost prices steadily flows in. When at last there are no new buyers, investors can see months and years of gains erased by a fast decline... We're seeing this phenomenon at work in the vital commodity we call Dr. Copper.

Below is a two-year chart of the red metal. Note how copper suffered a huge decline during the 2008 credit crisis. This decline bottomed at $1.30 per pound that December. Copper then staged a huge rally to $3.40 per pound over the next year. But in just the past two weeks, the bear has "jumped out the window" and erased three months of price gains. This decline has also smashed copper's year-long trendline.

Is this incredible copper decline reason "batten down the hatches" and expect the economy to head lower again? Not necessarily. But we can say copper has been punched in gut... and more losses here will at least get us prepared to "batten."

Euro crisis escalates: Investors pulling billions out of Greece

Remember the proverbial run on the bank? Well, that was the norm (or rather the outlier) before governments decided to backstop entire financial industries residing within their territory. As a result, the post-Lehman version of "the bank run" will henceforth be referred to as "the country run" and for an example of one in practice, look no further than Greece.

The Guardian reports that investors have pulled a stunning €8-10 billion since the Greek crisis commenced in earnest last November. If true, this is the beginning of the end for the troubled EMU-member country.

Sunday, February 7, 2010

THE NEXT WORST CURRENCY


Our chart of the week displays an asset giving the euro some competition in the "wet paper sack" contest.

To recap, we've tagged the euro as the weakest and most vulnerable currency in the world right now. Our chart on Friday showed how the euro plummeted last week. But now, Britain's currency, the pound, is saying "Don't count me out, old chap... My homeland is also choking on tons of bad debt and malinvestment."

Just recently, super investor Bill Gross warned that British government bonds are "resting on a bed of nitroglycerin." He's avoiding Britain's bonds and its currency due to huge levels of government borrowing.

To the right, you can see the market agreeing with Bill. Just this week, the pound violated its October low. This is a loud confirmation of Bill's bearish analysis. Euro: Get ready for a little competition on the race to the lower right of the chart!

Saturday, February 6, 2010

OUR CURRENCY TRADE IS OFF TO A GREAT START


For folks holding lots of euros in the bank, 2010 has become "the year of watching my savings disappear."

When looking for stocks, commodities, or currencies to bet against, market expert Dennis Gartman recommends targeting assets that exhibit weak price action compared to their peers. This is like "throwing rocks into a wet paper sack," according to Dennis.

Right now, mark the euro down as the "wet paper sack" of the currency complex. We identified the euro's "1-2-3 top" back on December 16th. Just after that piece, the euro plummeted to the $1.42 level. It then staged a brief relief rally before heading back down.

Lately, the euro has fallen nearly every day with no support whatsoever. Currency traders: Here's your wet paper sack. Currency holders: Here's another reason to keep a good portion of your savings in gold.

Even the Best Investors Make This Huge Mistake... Make Sure You Don't!

Personally, I have just one rule: Avoid big mistakes.

If I do that, I know I'll be fine. I know I won't "blow myself up" in my investments. Knowing that gives me peace.

I can't believe how many brilliant, successful people fail to do this one simple thing... and lose what they have... or even lose everything.

Look, if you do nothing else, remember this: Avoid big mistakes. And the biggest of the big mistakes is STILL DANCING when the music stops.

Get the heck out of there, my friend! If you're a little late to realize it, then STILL get out. Better late than never. Let me show you what I mean...

Chuck Prince, the former CEO of Citigroup, is a perfect example of a guy who kept on dancing...

In the summer of 2007, just as the banking crisis was getting underway, Chuck actually told the Financial Times he was "still dancing."

About the banking business, Chuck said, "When the music stops, in terms of liquidity, things will be complicated. But as long as the music is playing, you've got to get up and dance. We're still dancing."

But the music had already stopped when he was speaking. Shares of Citigroup are down 93% since he said that... just a year and a half ago. And Chuck lost his job less than four months later.

I've also seen it close to home...

Most of the wealthy investors where I live made their fortunes in local real estate – that's Florida real estate.

The music stopped in Florida real estate a few years ago... But even today, they're STILL dancing. If they had acknowledged the music stopped early, they might have been able to keep much of their wealth.

I could go on, with examples throughout history... from Sir Isaac Newton in the 18th century South Sea Bubble to George Soros in the 2000 tech bubble.

The message today is incredibly simple...

When the music stops, STOP DANCING.

Get off that dance floor... and do it fast. Do NOT allow small mistakes to become big ones.

It sounds simple. But as I briefly showed, even the smartest people succumb to it.

We are all vulnerable to the risk. So you must make a conscious choice here... you must tell yourself you will never let a small loss become a big one.

You can use whatever "system" works for you to reinforce this idea: stop losses, trailing stops, NOT averaging down a losing position, NOT taking too big a position in anything.

I actually use all of the above.

Whatever works for you, do it. The important thing is, do NOT let a small loss become a big one.

Want to be just fine, forever, in your investments? Then don't forget my one rule... Avoid big mistakes!

Friday, February 5, 2010

Morgan Stanley: This trade could be hugely profitable this year

Morgan Stanley analyst Sophia Drossos says shorting the euro and going long on the dollar is likely to make money across a wide range of economic scenarios in 2010.

Long U.S. dollar "is a trade that can work in environments of risk aversion as well as stronger global growth,” Drossos notes.

“Because we believe a revival in the global economy will be led by U.S. growth outperformance against G4 economies.

Mark Mobius: Huge opportunities in China

Emerging market stock guru Mark Mobius sees investment opportunities in the Chinese and Brazilian stock markets.

He likes bank shares in China, as the government’s effort to curb bank lending will boost China’s economy and snuff out bubbles.

“I don’t see a slowdown in lending as a bad thing,” the chairman of Templeton Asset Management told Bloomberg. “It moderates risk to some degree because people don’t go overboard.”

Over 820,000 jobs will disappear tomorrow morning

On Friday, expect to see the BLS revise job creation estimates down by a whopping 824,000 jobs. The culprit, as I have been harping on for a couple years is a birth-death model far out of sync with reality.

Bloomberg has some nice interactive charts in an article Birth Death Model Insights.

Originally the BLS said 4.8 million jobs were lost between April 2008 and March 2009.

This emerging market is bucking the trend

Most equity indices across the globe broke their short-term uptrends and moved below their 50-day moving averages on the most recent downturn.

Russia's main equity market index, the RTS, bucked the trend.

Thursday, February 4, 2010

BULLISH: BIOTECH AND ITS UNLIKELY NEW HIGH


Some interesting activity in the biotech sector...

Experienced traders know that when an asset holds steady – or even rises – when it should be falling, it's a bullish sign. They say the asset is "acting well." The same works in reverse. When an asset falls when it should be rising, it's "acting poorly."

Now here's what's interesting: In the past two weeks, folks have sold off all kinds of stocks... and riskier, more volatile assets like gold stocks and Chinese stocks have taken the worst beatings. Biotech stocks are considered some of the market's riskiest, most volatile assets. Yet as our chart today shows, the S&P Biotech fund (XBI) has not only held steady... it has struck a new 52-week high. This is impressive strength from biotech, considering its risky cousins are down big.

Longtime readers know we consider biotech stocks one of the great "boom and bust" market sectors. When a bull market gets rocking here, the gains easily go into the hundreds of percent. If the broad market rallies to new highs after this correction, expect biotech to lead the charge.

Worldwide stocks down this morning as Euro crisis builds

The European Union vowed on Wednesday to hold Greece strictly to an austerity plan to tackle the most severe debt crisis in the euro zone as market turmoil widened with Portugal giving investors a new fright.

The European Commission put Athens on an unprecedented short leash, demanding an interim report by mid-March on progress in reducing its huge deficit, and quarterly updates thereafter, partly due to accumulated mistrust of Greek statistics.

The EU executive conditionally approved Greece's three-year fiscal plan but said further cuts in public sector wages would be required if, as many economists believe, measures announced so far are insufficient to meet steep deficit-reduction targets.

Greek bonds and stocks rose briefly in response to Brussels' approval, but markets dipped again and ended in negative territory after fellow euro zone weakling Portugal cut a planned treasury bill issue due to high borrowing costs.

Bond King Gross: Do not invest in the U.S.

Bond management king Bill Gross favors investing in emerging markets over developed ones, thanks to superior economic performance in the former.

“Risk/growth-oriented assets, as well as currencies, should be directed toward Asian/developing countries less levered and less easily prone to bubbling,” Gross, chief investment officer at Pimco, wrote in his monthly investment outlook.

Wednesday, February 3, 2010

China officially in a bear market

The most basic definition of a bull or bear market is the market’s position when compared to the 200 day moving average.

Most chartists consider a market above the 200 day moving average to be in a bull market and a market below the 200 day moving average to be in a bear market.

China’s Shanghai Index recently broke below the 200 day and appears to be...

THE WORLD'S GREATEST OIL COMPANY IS ON SALE


Long-term investors take note: The world's best energy company is sporting an interesting share price.

Study the oil and gas industry for a while, and you're bound to realize ExxonMobil (XOM) is one of the best oil companies to ever turn a drill bit. The company is legendary for its efficiency and ability to value assets... which helps it generate high returns on capital for its shareholders.

Like most every stock, XOM shares were punished during the historic "stress test" of 2008. Shares fell from $94 per share to $62 in just five months. After a brief rally, shares traded back down to that low point in March 2009 and rebounded nicely. This mid-$60s area marks a price floor where seasoned investors will buy shares like crazy.

XOM is nearing the floor again. The company just made a huge natural gas acquisition, which most outsiders feel it paid too much for. This has sent shares down to the mid-$60s... down to that area of solid support.

Short-term considerations aside, ExxonMobil is a great company that lives and breathes "high long-term returns on capital invested." This is the mantra all investors should demand of their long-term holdings. Buying near "ultimate stress test" levels is a bonus.

When This Crisis Will End

We're out of the woods with this financial crisis...

That's my best guess at least, based on a study of the major financial crises through history.

The recent book This Time is Different: Eight Centuries of Financial Folly, by Kenneth Rogoff and Carmen Reinhart, takes a look at the history of major financial crises...

Boiling the book down to its simplest conclusions, here's what happens after a banking crisis:
  • Home prices and stock prices collapse dramatically over the course of several years.
  • The economy tanks and unemployment rises dramatically.
  • Government debts soar.
The book gives specific timelines based on history... It tells us how far things fall and how long these things last. And it gives us a pretty good idea of what to expect going forward.

Let's look at a few of their conclusions more specifically, starting with stocks...

Stock Prices

The authors found that real stock prices typically fall 56% over three and a half years, on average. In the current financial crisis, stocks already fell a bit more than that, in a much shorter period of time, bottoming in March 2009. Then they rallied dramatically.

Is the worst over in stocks? Or is another leg down coming?

I personally believe the worst is over.

At first, the crisis blindsided us, so the effect was dramatic. Now we're aware... more sober... So I think the lows we saw in March 2009 will be the ultimate lows for this crisis in stocks.

Home Prices

The authors found real home prices typically fall 35% over six years. This time around, home prices (like stocks) fell a bit more than the authors' average in a much shorter period of time.

Like stock prices, home prices have been recovering.

Is the worst over? Or did the recent home-buyer tax credit prop prices up?

I think the worst is over. I think we've seen the lows. But home prices may do basically nothing for many years.

Unemployment

According to the authors, unemployment typically rises by seven percentage points in a banking crisis... and unemployment stays "bad" for four years. So far, unemployment has risen by about five percentage points, and we're two years into this thing. So if the authors are right, unemployment could hit 12% and last two more years.

Government Debt

The authors state that government debt explodes by 86% above pre-crisis levels, on average. In the current crisis, quite frankly, I have no idea how much government debt has REALLY exploded. Nobody can know that answer... with all the creative things going on at the Federal Reserve and the Treasury Department.

So where does that leave us?

This crisis has been worse in magnitude than most, according to the authors' numbers. It's also been devastatingly quick.

The good news here is that we may already be out of the woods... Stock prices and home prices have been recovering for months. And unemployment has leveled off in the 10% range.

The bad news is the government's explosion in debts. But risks associated with that won't likely come home to roost in the next couple of years. That's a topic for another day.

In short, based on past crises, it's easy to make an optimistic case that the worst is behind us in the economy.

The great big enormous number Obama didn't tell you about...

Today, to much fanfare, the administration released its ridiculous $3+ trillion budget (we say + because at that size the one thing certain is that the budget will certainly never hit the target and while we wish it would be lower, we are certain it will end up materially higher), which consists of a "short" 192-page summary section and a 1420 page appendix.

We are confident that not one politician will read the whole thing from cover to cover. We won't either. Not because we don't care about what's in it, but because we are much more concerned with what is not included, namely $2.8 Trillion and $1.9 Trillion of MBS guaranteed portfolios at Fannie and Freddie, and…

THE SHORT-TERM "LINE IN THE SAND" FOR APPLE


A bearish development for the broad market: The great "lead dog" Apple is stumbling...

Every market phase has its "lead dogs." These are the companies that dominate their industry, like Google, Goldman Sachs, and Apple. Since it's so easy to make the case for owning these shares, most people do.

Apple is one of the world's "easiest" stocks to own right now. Its products are fantastic and selling like crazy. No Wall Street analyst is going to get fired for calling the stock a "strong buy"... No pension fund manager is going to get funny looks from his colleagues for holding it... Tell folks at the cocktail party that you own Apple and you'll get nods of approval. The stock is one of the recent rally's "lead dogs," having climbed as much as 144% from its March low.

Apple's popularity among investors has allowed it to hold steady during the recent market decline. Not many stocks have displayed this sort of strength. But as you can see from today's chart, Apple is dangerously close to violating its December low of $189. A downside breakout below this level is an ugly sign for the overall market. If the "lead dogs" can't keep running, the whole team is in trouble.

Tuesday, February 2, 2010

China's gold output soared in 2009

Unlike South Africa, China has managed to set a new record in gold production in 2009 and even reduced the number of producers in the country.

According to reports, China’s gold output rose 11.34 per cent to a record of 313.98 tonnes in 2009. This is despite a big fall in number of producers. China has been closing and integrating some small and obsolete gold producers. The total number of gold producers fell from more than 1,200 in 2002 to about 700 in 2009.

China’s annual gold output exceeded South Africa in 2007.

Monday, February 1, 2010

THE "LONG VIEW" ON GOLD


OK... we timed our late-November "gold is overbought and ready for a decline" forecast pretty well. Gold has fallen from over $1,200 an ounce to below $1,100 an ounce. But before you get too concerned with the decline, consider this...

Gold is "real money" and wealth insurance. But you can't value it the way a stock buyer says, "I'll pay 10 times earnings for this company," or the way a real estate investor says, "I'll pay eight times annual rent for this house." This "hard to value" component makes the metal fluctuate wildly with investor sentiment.

Don't be surprised if the next "fluctuation" is toward lower prices. The dollar is rallying from a deeply oversold condition... which likely means lower gold prices.

But instead of panicking over your gold, take the long view. Here is a five-year chart of gold.

As you can see, gold could fall all the way down to $850 and still remain in the confines of its long-term bull trend.

THE MONEY MARKET

FRIENDS