Pages

Saturday, July 31, 2010

This star hedge-fund manager could replace Warren Buffett

Li Lu, the hedge-fund manager who helped Berkshire Hathaway Inc. find profits in China, may push Warren Buffett’s investment company to make more deals outside the U.S. if he takes a role at the company.

“He is a person that Buffett has confidence in from a trust standpoint and who has experience from an international standpoint,” said Michael Yoshikami, who oversees about $1 billion, including Berkshire shares, at YCMNet Advisors in Walnut Creek, California. Hiring Li would mean “Buffett recognizes that the strategy that has worked in the past has to be adjusted in the new environment where more stable economies are likely to grow at slower growth rates.”

Li, 44, is in line to be hired as one of the executives who would eventually replace Buffett, the 79-year-old chief executive officer, and help manage Berkshire’s investments, the Wall Street Journal reported. Berkshire Vice Chairman Charlie Munger said “it’s a foregone conclusion” that Li would probably become a top investment official at Berkshire, the Journal reported.

Buffett is seeking more opportunities abroad after the 2008 investment in China’s BYD Co., which has jumped eightfold. Li helped arrange the deal, according to the Journal.

Buffett plans to tour Japan and India next year in search of deals. In May, he praised the prospects for economic growth in China. Omaha, Nebraska-based Berkshire, which Buffett has run for four decades, is ready to spend $10 billion on its next takeover, Buffett said this year.

Investment Soars

Berkshire’s 9.9 percent stake in BYD, the Chinese car and battery maker, soared to a market value of $1.99 billion at the end of December from a purchase price of $232 million. Li’s assistance on BYD helped Berkshire make the deal, said Thomas Russo, a partner at Gardner Russo & Gardner in Lancaster, Pennsylvania.

“He’s the person who could bridge the cultural gap with the BYD founding families,” said Russo, a Berkshire investor. Li helped Berkshire win “terms that are so different than what most Western companies have experienced” in China, Russo said.

Li started a fund with money from Munger, and he wrote the forward to the Chinese version of the Berkshire executive’s Poor Charlie’s Almanack. In the English-language collection of Munger’s quotes and ideas, Buffett wrote the forward.

Munger’s Collaborator

Li’s original fund had annual compound growth of more than 29 percent, from inception in January 1998 through the end of 2009, the manager said in Poor Charlie’s. Another fund posted an annual compound return of more than 36 percent, Li said.

Li, former president of the Student Congress on Tiananmen Square, graduated in 1993 from Columbia University, where Buffett went to business school. The money manager met Munger after college and the two exchanged thoughts on investing, according to an essay Li wrote for the China Entrepreneur Magazine in May and posted on the website of his hedge fund, Himalaya Capital.

Buffett, Munger and Li didn’t return calls and e-mails to their assistants.

In an interview with the Journal, Buffett declined to rule out the possibility that he would bring in an investment manager while still CEO at Berkshire. Buffett wouldn’t discuss succession plans specifically, the newspaper reported.

Buffett’s responsibilities will be split upon his death or retirement among at least three people, the company has said. A CEO will oversee the collection of more than 70 operating units assembled by Buffett and Munger, and one or more investment managers will allocate capital and manage Berkshire’s portfolio. Buffett’s son Howard will probably assume the position of non- executive chairman to preserve the firm’s culture.

‘High-Grade’

“I have the pleasure of knowing Li Lu and he is a brilliant and high-grade individual,” Whitney Tilson, founder of hedge fund T2 Partners LLC, said in an e-mail. “I am thrilled for him as well as for Berkshire Hathaway, which is one of our largest positions.”

Buffett said last year that he had four candidates to succeed him as chief investment officer. He didn’t publicly name them. Earlier, he’d said that he would audition managers who are “genetically programmed” to avoid large risks.

Friday, July 30, 2010

THE GREAT CIGARETTE DIVIDEND MACHINE HEADS HIGHER


Last week, we heaped abuse on the "perfectly hedged" clean energy fund. This kind of investment somehow manages to lose money in both good times and bad.

This week, we take a look at the antidote to faddish ideas like solar and wind energy: We look at the past year's price action in Altria (MO).

Altria is the world's dominant cigarette maker. It's a stock Dan Ferris and Tom Dyson have written bullishly about in DailyWealth (check out their arguments here and here). While it's easy to understand Marlboro's incredible brand power, most people don't understand the government loves it when folks buy Altria cigarettes. The government is even more addicted to the huge taxes it collects from Altria than Altria's customers are addicted to its product.

As you can see from our chart below, the cigarette business is doing well these days. Altria just struck a new 52-week high. Despite this price gain, the stock still yields over 6%. This chart proves that when it comes to making long-term investments, there's no need to chase the "next big thing"… just stick with the incredible cash flow and dividend-producing power of "World Dominators" like Altria.

Thursday, July 29, 2010

CHART OF THE WEEK: GOLD AND APPLE – A GOOD PAIR


This week's chart is a tale of two "crisis-beating" assets. Gold and Apple.

In the past three years, just about every asset you can think of has either lost money or treaded water. The 2008 credit-crisis selloff was so severe, even recent rallies haven't been able to carry assets back to their levels of a few years ago. Two exceptions here are gold and shares of Apple.

Below is what's called a "performance chart." Performance charts graph the percentage returns of assets against each other. In this case, it's the past three years of gold (gold line) and Apple shares (blue line).

Amazingly, both assets have registered the same gains since mid-2007… around 80%. Gold is enjoying price strength because of its role as "real money" crisis insurance. Apple is enjoying brand dominance in phones and music players. It's a heck of a "pairs trade."

Wednesday, July 28, 2010

THE CLEAN ENERGY FUND? YES, STILL PERFECTLY HEDGED


Today, we take another look at one of most perfectly hedged investment funds on the market: The big "clean energy" fund, PBW.

DailyWealth readers know we believe long-term investors should focus on boring, dividend-producing businesses like Altria and Johnson & Johnson. The investor is best served by stable, dividend-paying businesses that produce "never go out of style" products like cigarettes and Band-Aids.

Yet many investors are enamored with the idea of investing in clean energy companies… most of which sport such terrible business models that we like to call them "perfectly hedged." They lose money in both good economic times and bad economic times. Their share prices are able to sink in both bull markets and bear markets.

For a picture of this hedged condition, we present the past two years of trading in the PBW. As an easy, "one click" way to go long solar, wind, and various other clean-energy companies, this fund has drawn in hundreds of millions of investor dollars over the past few years.

As you can see from today's chart, this fund managed to get smashed during the 2008 asset selloff. It also managed to not rise during the great 2009 rally… And it continues to tread water. Our advice remains: Ditch the money-losing fad stocks and get into businesses that churn out profits even when the sun is down or the wind isn't blowing.

Tuesday, July 27, 2010

IT'S A BEAR MARKET IN NANOTECH


Around twice a year, we check in with shares of a small company called Harris & Harris. It lets us monitor one of the biggest potential uptrends in the world: nanotechnology.

Nanotechnology is the science of manipulating matter on an extremely small scale… as small as an atom. It holds the extraordinary promise of turning lumps of coal into diamonds… building tiny machines that can clear out blood vessels… or turning toxic waste spills into pristine lakes. As investment "stories" go, nanotech is about as good as it gets.

Harris & Harris is one of the few pure stock plays on the nanotech story. H&H doesn't make nanowidgets or provide nanoservices. It simply funds start-up nanotech companies. The imaginatively named Nanosys and NanoGram are among its investment holdings. H&H even has the ticker "TINY." Thus, TINY rises and falls with how well the nanotechnology story is translating into real investment gains.

As you can see from today's chart, the nanotech story is in a bear market right now. Harris & Harris is down 31% in the past three months and just struck a new 52-week low. Folks aren't interested in paying up for nanotech innovation these days. We're sure this story will eventually be on the pages of every financial magazine you can think of, but for now, it's rough going for nanotech.

Monday, July 26, 2010

ONE OF THE MARKET'S "MUST WATCH" INVESTMENTS


It's back to moving sideways for U.S. banking stocks.

This past March, we profiled the long, sideways trading pattern in XLF. This fund is a basket of the largest financial companies in America. Major holdings include JPMorgan, Goldman Sachs, Wells Fargo, American Express, and Bank of America. These are the companies that rise and fall with America's ability to earn money, invest money, service debts, and launch new businesses.

Last year, XLF enjoyed a huge rebound off its credit-panic lows. But in October, the uptrend faltered… and turned into a long period of sideways trading action. Several months ago, XLF rallied out of this sideways pattern. But as you can see from today's chart, that rally soon gave way to weakness that took XLF back to sideways.

We recommend keeping an eye on this big $13-$15 channel… and on the direction XLF breaks out. As we said, XLF's constituents are the backbone of our banking and credit system… so its share price is a good clue to what's really happening in the economy, no matter what politicians or CNBC commentators blather on about. Money talks and you-know-what walks. You can listen in with XLF.

Sunday, July 25, 2010

A Safe, Easy 45% Profit… Thanks to Bernanke

The people who set short-term interest rates in the U.S. just showed their cards last week…

Thanks to the minutes to the latest Fed meeting, we now know what Fed Chairman Ben Bernanke's playbook is.

Bernanke is making it easy for us to invest… In short, he will keep money as "easy" as possible, for as long as possible – likely beyond 2012.

Today, I'll show you the safest, easiest way to make large profits from Bernanke's easy-money deal. Our target gain is 45% in one year.

To understand what Bernanke is up to, think of it this way… He's trying to light up the U.S. economy like it's a grill. He's dousing it with rocket fuel and pumping away on the "start" button. We're just waiting on the "WOOSH!"… the big flame. He's trying so hard, we're just standing back and waiting for his eyebrows to get burned off.

But chances are, he won't see a "WOOSH." Or more specifically, he won't see the economy light up like he wants. Instead, all Bernanke's rocket fuel will do is light fires elsewhere.

He'll create asset bubbles – like tech stocks in the 1990s or housing in the 2000s – that will eventually result in spectacular busts. But Bernanke won't care about those. All he cares about is igniting the grill in front of him.

According to the minutes to the latest Federal Reserve meeting, the Fed expects the economy will grow a bit slower than it thought… Unemployment will be a bit higher… And core inflation will be lower – only around 1% through 2012.

If those guesses from the Fed are even close to correct, it will keep interest rates near zero for a very long time.

That will make money next-to-free to borrow. The obvious beneficiaries of free money are "virtual banks" like Annaly (NYSE: NLY).

If you've read my writing for any amount of time, you probably know how the story goes with these…

"Virtual banks" are essentially built to take advantage of the government's control of interest rates. These virtual banks borrow money at current (incredibly low) rates, and then buy 100% government-guaranteed mortgage bonds, which yield over 4%. So they take on no credit risk.

They make money off of the interest-rate spread, and they pay high dividends – in the 15% range. And right now, they're cheap! In addition to high dividends, we have room for 30% capital gains in Annaly…

Currently, Annaly is trading near book value. I fully believe it will rise to 1.3 times book value. Why? It's simple…

The dividend yield is just too attractive. I am certain income investors will be willing to bid up the share price of Annaly so high that the dividend yield falls to 11.5%. Think about it. Which would you prefer? Earning less than 1% in the bank? Or earning 11.5% in Annaly for a little bit more risk? An 11.5% dividend would put Annaly at 1.3 times book value.

In short, you'll collect 15% interest while you wait on a 30% capital gain. If it happens within a year, you can make 45% total returns (capital gains plus dividends) – in a totally safe investment.

We have 30% upside in Annaly – and we're getting paid 15% a year in interest. Not a bad deal.

Bernanke and the Fed have shown us their hand, and low interest rates are going to be here for a long time. Take advantage of the Fed and invest in "virtual banks," like Annaly, at today's low price.

Plan on holding for a year or taking profits at 1.3 times book value, whichever comes first.

Saturday, July 24, 2010

THE BIG MONEY IS SELLING, NOT BUYING


The message of today's Market Notes: The "big money" needs to show up… and it needs to show up soon.

A healthy bull market is driven by the huge buying power held by mutual funds, hedge funds, pension funds, and insurance company funds. These investors control multibillion-dollar portfolios… they are the "elephants" of the stock market. Even a private investor with $10 million is a mouse by comparison. Only with strong and ongoing buying enthusiasm from the elephants can stocks climb higher. Now, here's where it gets worrisome…

Today's chart shows the past six months of trading in the Dow Industrials investment fund (DIA). This is a basket of America's biggest, most important companies. Below the price chart, you'll find a window displaying the fund's daily trading volume. The red bars represent trading volume on days the fund declined. The gray bars represent trading volume on days the fund advanced. The taller the bar, the greater the volume. Monitoring trading volume is how we track the elephants.

As you can see, the period of advancing prices during March and April was marked by "ho hum" trading volume (A). May's big selloff was marked by huge trading volume (B). Investors were dumping stocks with much greater enthusiasm than they were buying them. Now notice that each rally since has come on weak volume (C)… while each decline came on higher volume (D). This is a troubling lack of interest from "big money" investors. This "weak buying volume, strong selling volume" trend needs to change if stocks are to rally into year end.

Friday, July 23, 2010

How to Make a Safe 7% Interest in a 0% Interest World


The economy is moving back into recession…

John Hussman, the highly respected manager of Hussman Funds, has built a recession warning system from four financial indicators. He calls this system his "Recession Warning Composite."

Over the last 50 years, Hussman's warning system has a perfect record of predicting recessions. It's never flashed a faulty signal… and it's never failed to flash before a recession.

Right now, Hussman's indicator is NOT flashing recession… but it's on the verge of giving the signal. It'll likely flash in the next few weeks.

"The U.S. economy is most probably either in, or immediately entering, a second phase of contraction," Hussman concludes. (You can read Hussman's commentaries here.)

From my desk, it looks like a combination of the largest government stimulus in history, businesses restocking their inventories, and millions of homeowners getting to live rent-free while their homes are in foreclosure caused a brief 18-month relapse from the recession that started in 2007. Now, the government has pulled back its stimulus, businesses are fully stocked, and evicted homeowners have to pay rent again… And the economy is rolling over.

The stock market is anticipating these developments. It's already down 10% from its highs three months ago… and although it bounced back last week, one glance at a long-term chart of the S&P 500 tells you everything you need to know. This market is trending down again:

This is bad news for income investors. In a falling stock market, all the best income investments – like real estate investment trusts (REITs) and master limited partnerships (MLPs) – are no-go areas. Worst of all, the Fed won't raise interest rates while the economy is weak. This leaves us with interest-free bank accounts and 1% CDs.

Finding solid income investments in an environment of zero percent interest rates, a recession, and a falling stock market is not possible for most investors. It's simply a terrible time to be an income investor.

What should you do? I recommend you start looking at bonds…

Bonds have two big advantages over stocks. First, they're safer. When you buy a bond, you're lending money to a company. The company has a legal obligation to return your money in full, with interest. With stocks, there's no such guarantee. Your money is in the hands of the market and anything could happen. Second, bonds pay higher income rates than stocks.

The trick to buying bonds in a recession is to only buy bonds issued by rock-solid companies that have no possibility of going broke. I look for companies with huge cash balances and low debt. When a company has more cash than debt, it's not going to go broke.

Then, I look for high yields. In this market, you should be happy anytime you find a "safe" bond paying over 5%.

Where can you buy bonds? Your broker is one option. Most bonds aren't publicly traded, but your broker may have a selection of bonds in inventory for you to choose from. Your broker might also be able to get bonds from other brokers. Call them up and ask to speak to a fixed-income trader.

Buying bonds on the stock market is my favorite option. Most people don't know this, but over 1,000 bonds and other fixed-income investments trade on the stock market, just like regular stocks. They have common ticker symbols, and you can buy and sell them anytime you want through any discount broker.

Right now, in my 12% Letter portfolio, we have nine of these "stock-market bonds." They're currently yielding an average 7%. And we're guaranteed to get our principal back.

It's hard to find information on "stock market bonds," but one website does a great job. QuantumOnline lets you look at complete lists of all the different stock-market-traded fixed-income investments, including preferred stocks, trust preferreds, bonds, and convertible bonds.

You can even put a stock symbol into its quote box and it'll tell you if that company has any related fixed-income securities trading on the stock market. (Look for the "related securities" link.) QuantumOnline is free, but you'll need to register a username and password before you can use it.

If you're tired of collecting 0% or 1% on your cash, I suggest you get started building a portfolio of bonds today.

Thursday, July 22, 2010

A LOOK AT OUR TOP ECONOMIC INDICATOR


Our chart of the week is our old friend Dr. Copper. This week, he's saying, "Things aren't so bad."

You see, one of the great debates in the investment community right now is whether the global economic recovery "has legs." On one side, you have the optimists, who say the recovery is real and we're doing just fine, don't worry so much. On the other side, you have the pessimists, who say the recovery is a short-term goosing based on cheap credit… and the bear market of 2008 will resume within a year, go ahead and worry and invest accordingly.

One way to monitor this argument is by watching the price of copper. Copper is in nearly everything around you… from cars and plumbing to electronics and power lines. This "in everything" attribute makes the metal rise and fall with economic activity.

In early June, we published a bearish note when copper "broke down" to $2.80 per pound, its lowest low in eight months. Copper promptly bounced from this level and now sits near $3 per pound. As long as copper remains buoyant and above the breakdown level of $2.80, one has to say the optimists are winning.

Wednesday, July 21, 2010

ANOTHER LOOK AT THE CONTRARIAN'S COMMODITY


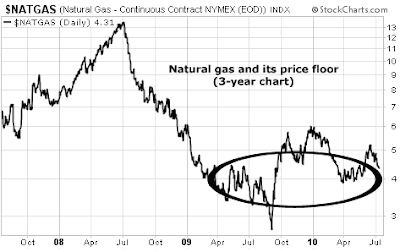
One idea our guest essayist Chris Mayer likes, just as we do, is investing in what we're calling the "contrarian's commodity," natural gas.

Natural gas is used to produce fertilizers, plastics, and various chemicals. It's also a major source of fuel for firing electrical power plants and heating homes. Hippie environmentalists love the stuff because burning gas emits less than half as much carbon dioxide as burning coal.

We call natural gas the "contrarian's commodity" because huge new gas supplies have come on line recently… which has sliced the price of "natty" by more than 60% since 2008.

This beaten-down condition allowed gas to weather the huge May market selloff as well as any asset. While most stocks and commodities suffered big hits during that month – and sellers came after natty, too – it simply looked up from its position on the ground and said, "I've already sold off like crazy… I can't go down anymore." As you can see from today's chart, natural gas has built a solid "floor" around $4… and is now a contrarian's buy.

Tuesday, July 20, 2010

Stocks Haven't Been This Cheap in Over 20 Years

I have friends and family invested in the ideas I write about in my advisories.

So, when I see someone, the conversation usually turns to stocks. You know how most people comment on the weather in some way early in a conversation. With me, it's the market people want to talk about first.

With the recent market swoon, I've had some folks ask if they should even be in stocks at all. Some 42% of individual investors are bearish and only 25% are bullish, according to a recent American Association of Individual Investors poll.

Newspapers and the like often cite this poll. It's a useful contrarian indicator. When people are bullish, look out. When people are bearish, then perhaps it's a good time to think about buying. Right now, the poll says you should look to buy.

I think most investors are fearful because they focus on the drumbeat of bad economic news. There is a lot of angst over the latest employment numbers, or the manufacturing index, or whatever.

But here is the thing: None of this really has much to do with investing. A lousy economy can be a great place to invest. And an economy in great health can be a terrible place to invest. It all depends on prices. All the noshing on economic data doesn't mean much without some context. You need to know what you get for what you pay.

On that front, things don't look so bad. As Barron's reports, "The forward P/E on the S&P Index is below 12, the lowest since the late 1980s." Unless profits collapse, the market overall does not look expensive. Many of the big stocks in the S&P 500 trade for 10-12 times their 2010 earnings estimate.

Some of them are cheaper than they appear because they have so much cash. Companies like Microsoft and Cisco have $4 per share (about 20% of their market caps) in net cash. If you net out the extra cash, the price-to-earnings ratios fall even further.

Keep in mind, profits have already collapsed. So while profits are growing now, they are still way below pre-recession levels. We're working off a low base.

Beyond this, I think a lot of how you feel about investing comes down to time horizon. I feel pretty good about recommending the stocks in my advisories right now. There are plenty of great opportunities out there if you dig around for them. But I don't know if they'll work in the next three months. I think long term.

I'll quote value investor Clement Fitzpatrick (in Barron's), who gets it exactly right when he says, "It all depends on one's time horizon. Investors who look six months into the future don't behave the same as those who look five years into the future. They come to radically different conclusions."

The market is extremely short-term focused. So you can get an edge if you think out even a year from now.

But let me be clear about something: I don't think the U.S. economy is in good shape. I am most discouraged when I consider the bloated and out-of-control federal and state governments. They spend too much. They are in too much debt. They are far too powerful. And I think it is fair to say that the current administration is hostile to business. I think the U.S. dollar is a sick currency.

This is why I've been investing in overseas themes and ideas. There is a lot of exciting activity in pockets around the world. There is, for instance, a growing new pool of consumers, particularly in Asia, but also Latin America and other developing countries.

There are great opportunities, too, in necessities and scarcity – in things like food and energy and water. I like resource companies – loaded with such things as uranium or potash – and their ability to create wealth.

All this is to say I am not discouraged by the stiff correction from the April highs. I'm still recommending stocks. It's not a popular idea right now… which why I'm confident it's a good one.

Monday, July 19, 2010

Turn $10,000 into $2 Million with My Simple Gold Strategy

I came up with a Simple Strategy to tell you when to own gold… and when not to.

It's so simple, you could teach a monkey to follow it.

Best of all, $10,000 invested in this Simple Strategy would have turned into nearly $2 million. Just buying and holding gold over the same time period would have turned $10,000 into just $300,000.

The chart here tells the story… The blue line is the Simple Strategy. The gold line is the price of gold:


Not only did this Simple Strategy dramatically outperform the price of gold, it did so with substantially less volatility…

My Simple Strategy managed to steadily rise from the lower left of the chart to upper right. It almost entirely avoided gold's big fall in 1975-1977. And it generally avoided gold's two-decade fall from 1980 to 2000.

The Simple Strategy is so simple, it's almost embarrassing. But it is based on an important point. Let me explain it…

How do you know when it's a bull market in gold? Sometimes people will say, "Oh, it's not a bull market in gold… It's simply a bear market in the dollar."

You see, if the U.S. dollar is crashing against other currencies, it's probably also going down in terms of gold. That can make it look like gold is in a bull market. But what if gold is falling in terms of the euro or the yen? That's not a gold bull market.

So what is a bull market in gold?

One simple definition is: when gold is going up in terms of the world's most important currencies. I took a look at the four most widely traded currencies… the U.S. dollar, the euro, the British pound, and the Japanese yen. And I came up with my Simple Strategy. Here's how it works:

If gold is up versus all four currencies over the previous month… buy gold. Repeat the next month.

That's it.

When I tested it over the last 40 years of data, the results were astonishing… When gold was up versus all four currencies in the most recently ended month – when my Simple Strategy flashed a buy signal – gold rose at a compound annual rate of 35%. My Simple Strategy was in buy mode about a third of the time. (All the rest of the time, astoundingly, gold lost money.)

If you simply bought gold when you got a signal and then switched to cash (Treasury bills) when the signal was off, you'd have turned a $10,000 investment in 1971 into nearly $2 million today.

Since 1971, the price of gold has risen at a compound annual rate of 9.2% a year. By using this much less volatile Simple System, where you're invested in gold about one-third of the time, your wealth would have compounded at 14.5% a year.

This system is simple, but it's sound… History shows that a great predictor of when gold will go up is when it's already going up versus the major currencies.

It would be easy to refine my Simple Strategy to produce more dramatic results (and chances are we will for a future product we're working on). Or you could leverage it up with a double-long gold fund, for even bigger profits.

But at the very least, now you know how to find out if conditions are bullish for gold.

In case you're curious… we're in a bull market in gold… and we have been since March. Each month, gold has been up against all four currencies. Trade accordingly.

Sunday, July 18, 2010

THE CONTRARIAN TRADE OF THE WEEK


Contrarian traders take note: The huge wipeout in offshore drilling companies has exhausted itself.

For a picture of this exhaustion, we look at the past 12 months of trading in offshore driller Diamond Offshore (DO). Diamond Offshore is one of the world's leading drilling contractors. The legendary Tisch family investment dynasty owns a huge portion of the company. Its rigs can command rates of over $500,000 per day.

To the right side of the chart, you'll see the "Deepwater Horizon effect" on Diamond's shares. The Gulf of Mexico drilling disaster and worries over lost earnings caused incredible declines throughout the drilling sector… including Diamond, which lost 35%.

Now note how Diamond shares have dug a "toehold" in the $60-per-share range and staged a modest rally. Also note that the stock trades for less than eight times earnings… and note that on Friday, Diamond became the first company to send a drill ship out of the Gulf of Mexico in response to the drilling ban. It will soon be at work off the coast of Africa.

Traders… you have your unloved, beaten-down sector… you have value… and you have your "toehold" at $60 per share to trade from the long

Saturday, July 17, 2010

A HUGE BREAKOUT IN THE GOLD STOCK SECTOR


Good news for gold stock owners: One of the big "bellcows" of the industry has decisively broken out to a new all-time high.

For the past five years, large-cap gold mining stocks have been criticized for not producing the kind of returns folks expected during a period of rising gold prices.

Major gold miner Newmont Mining (NEM), for example, has treaded water since 2006… even though gold itself has doubled in price. Costs like infrastructure, manpower, and fuel have climbed along with gold prices over the past five years… which has capped earnings.

But as you can see from today's chart, the recent increase of gold from $950 to $1,200 per ounce has had a big effect on Newmont's cash flows and share prices. It has sent this bellcow to a five-year high. If you're long gold stocks, this is a beautiful picture…

Friday, July 16, 2010

U.S. stripped of AAA credit rating... By China

Despite repeated warnings going back several years from Moody's, S&P et al that the U.S. could lose its top credit rating with ongoing fiscal deficits and heavy debts, the platinum-plated AAA rating of the United States seems all untouchable.

The top notch rating certainly has helped with continuing debt financing and bolstering the confidence of some government officials. Secretary Geithner, for example, said in a February interview that the U.S. government "will never" lose its credit rating, despite big budget deficits and a newly raised debt ceiling of $14.3 trillion.

Along came a Beijing-based rating agency...

Thursday, July 15, 2010

Euro contagion: Moody's downgrades Portugal

The euro fell against the dollar and yen after Moody’s Investors Service downgraded Portugal’s credit rating, stoking concern about the region’s fiscal health.

The dollar and the yen rose against most of their peers as China’s clampdown on speculative property investment and steel production stoked demand for the currencies as a haven, and sent Australia’s dollar lower. Portugal was cut two notches to A1 at Moody’s, which cited a growing debt burden and weak economic growth prospects. The euro stayed lower as a report showed German investor confidence declining for a third month in July.

“The downgrade reminds investors that there’s still problems in Europe,” said Adam Cole, head of global currency strategy at Royal Bank of Canada Europe Ltd. “While this isn’t a huge surprise for the market, it will help the euro lower.”

The euro fell 0.4 percent to $1.2544 at 10:15 a.m. in London, a third straight decline against the dollar. The 16- nation currency dropped 0.7 percent to 110.82 yen, while the yen strengthened 0.2 percent to 88.44 per dollar.

The Mannheim-based ZEW Center for European Economic Research today said its index of investor and analyst expectations, which aims to predict developments six months ahead, fell to a 15-month low of 21.2 from 28.7 in June. Economists had forecast a drop to 25.3, according to the median of 34 forecasts in a Bloomberg News survey.

Chinese Tightening

The Australian dollar fell from the strongest level since June on concern China’s attempts to tighten policy would curb demand for commodities.

The Shanghai Composite Index lost 1.6 percent and the MSCI Asia Pacific Index of regional shares slid 0.5 percent. BHP Billiton, the world’s largest mining company, sank as much as 2.8 percent. Chinese property developers fell as the nation’s banking regulator said it hasn’t changed policies on home loans, and called on lenders to strictly enforce existing rules.

Li Yizhong, head of the Ministry of Industry and Information Technology, said China will push for mergers in the steel industry and curb any rapid increase in steel production, according to a speech posted on the ministry’s website today.

Australia’s currency dropped 0.6 percent to 87.07 U.S. after touching 87.93 cents yesterday, the most since June 22.

“Markets seem to be looking for an adjustment in Chinese growth and we’re seeing a bit of profit-taking in the Aussie leading into those announcements,” said Jim Vrondas, a manager at the online foreign-exchange dealer OzForex Ltd. in Sydney. “The Aussie is running out of momentum and if we get a clear break below 86.80 cents, I think we can see more downside throughout this week.”

‘Vulnerabilities’

The euro also fell amid concern tests to demonstrate the resilience of the region’s banking system will fail to reassure investors. European officials called on banks to try to raise money themselves before seeking state support if stress tests by regulators reveal “vulnerabilities.”

“It is firstly up to the banks themselves,” Dutch Finance Minister Jan Kees de Jager said in Brussels yesterday after a meeting with euro-area counterparts. “They will get a certain period to refinance themselves in the market, but the countries will immediately announce that there is a certain backstop.”

Banks that fail stress tests will, “in the worst case,” need government aid to strengthen their balance sheets, German Finance Minister Wolfgang Schaeuble said today.

“The goal is to make it clear that European banks are stable and wherever there are problems, there have to be consequences,” Schaeuble said on Deutschlandradio. The tests “won’t create disturbances, but rather clarity,” he said.

Stress Tests

European Union regulators are examining the strength of 91 banks to determine whether they can survive potential losses on sovereign-bond holdings. EU finance ministers will gather in Brussels today to discuss the procedure of stress tests and the disclosure of its findings.

“There are concerns that stress tests will prove to be insufficient to dispel underlying concerns about the depth of the sovereign problem in the region,” said Shuzo Kakuta, a senior foreign-exchange adviser at Tokyo Tomin Bank Ltd. “The euro will remain under pressure.”

Spain, Portugal and Ireland face a 20 percent risk of having to restructure their public debt, while the likelihood is 40 percent for Greece and 10 percent for Italy, said Robert Mundell, a Columbia University professor who won the Nobel Prize in 1999 for research that helped lay the foundation for Europe’s single currency. He spoke in an interview with Bloomberg Television in Siena, Italy, on July 11.

U.S. Earnings

The yen had fallen earlier as earnings from Alcoa Inc., the largest U.S. aluminum producer, stoked optimism about corporate profits in the world’s biggest economy.

“There is emerging optimism that the ongoing quarterly reporting will underscore continued profit growth at U.S. companies,” said Hiroshi Higa, senior strategist in Tokyo at MoneySquare Japan Inc., an online currency trading company. “Such a view will ease risk aversion and put some downward pressure on the yen.”

Alcoa said second-quarter earnings from continuing operations were 13 cents a share, exceeding the 11-cent average estimate of 17 analysts surveyed by Bloomberg. The stock rallied more than 3 percent in extended trading.

Profits for S&P 500 companies are projected to have increased 34 percent in the April-June period, and by the same amount in 2010, according to analysts’ estimates compiled by Bloomberg. A total of 23 companies in the S&P 500, including Google Inc. and Citigroup Inc., will report earnings this week.

Wednesday, July 14, 2010

Chinese stocks are falling again

China’s stocks fell, with the benchmark index declining the most in two weeks, after the government quashed speculation it will abandon real-estate curbs that drove property prices lower for the first time in 16 months.

China Vanke Co. and Bank of China Ltd. dropped among developers and lenders after the government said it will “strictly” enforce housing policies to prevent speculative real estate investment. Jiangxi Copper Co., China’s biggest producer of the metal, slid 3.1 percent, ending five days of gains, while China Shenhua Energy Co. retreated 2.3 percent.

“It’s hard to believe that the government would reverse its crackdown on the property industry so quickly and anyone who hoped so is now disappointed,” said Zhang Ling, a fund manager at Shanghai River Fund Management Co.

The Shanghai Composite Index, which tracks the bigger of China’s stock exchanges, lost 40.43, or 1.6 percent, to 2,450.29 at the close, the biggest decline since June 29. The CSI 300 Index fell 1.6 percent to 2,634.59.

The Shanghai Composite jumped 3.7 percent last week, the most this year, on speculation the government will adopt a looser monetary policy. The gauge has slumped 25 percent in 2010, making it Asia’s worst performer, on concern government efforts to curb inflation and property speculation will slow the economy.

China’s property prices fell 0.1 percent in June from the previous month, ending 15 months of gains, statistics bureau data showed yesterday. New lending of 603 billion yuan ($89 billion) last month was the least in three months, the central bank said July 11.

Property Curbs

The Ministry of Housing and Urban-Rural Development reiterated that it will maintain curbs on speculative purchases and increase market supply. The statement was in response to media reports that said China may abandon its current property policies, it said.

China’s banking regulator said it has made no changes to policies on home loans, according to a statement late yesterday. The regulator called on commercial banks to strictly enforce home loan rules, it said.

Vanke, the nation’s biggest developer, fell 2.4 percent to 7.46 yuan. Price cuts by Vanke have been among signs the market is cooling as the government cracks down on speculation. Poly Real Estate Group Co., the second largest, dropped 4.3 percent to 11.33 yuan.

A measure of property stocks on the Shanghai Composite slumped 3.2 percent, the most among the five industry groups. The real-estate gauge jumped 2.6 percent yesterday after the Southern Metropolis Daily reported China may loosen curbs on third-home loans. Some Chinese banks have eased standards for mortgage lending, at least on a case-by-case basis, Credit Suisse Group AG said in a report yesterday.

Banks Retreat

Bank of China, the nation’s third-biggest listed lender, retreated 1.7 percent to 3.51 yuan. Industrial & Commercial Bank of China Ltd., the largest, lost 1.2 percent to 4.25 yuan.

Shanghai-based commercial banks have maintained second-home loan curb policies which have not been loosened, the Shanghai Banking Association said yesterday. The Oriental Morning Post reported July 8 that some commercial banks based in the city have eased policies for second-home buyers.

Authorities intensified a crackdown on property speculation in April. Besides raising minimum mortgage rates and down- payment ratios for some home purchases, the government has pledged to boost land supply and the construction of low-cost public homes. Officials may also trial a property tax, according to state media.

China needs to “normalize” monetary policy to stablize economic growth, the China Business News reported Wu Xiaoling, a former People’s Bank of China deputy governor, as saying. Wu called last year’s policy “extremely loose,” the report said.

Property ‘Collapse’

“The government isn’t likely to relax tightening measures as it wants to transform the country’s growth model to focus on consumption rather than investment,” said Zhang Qi, an analyst at Haitong Securities Co. in Shanghai.

Harvard University professor Kenneth Rogoff said July 6 that a “collapse” in real estate is beginning, while Barclays Capital forecasts prices may fall as much as 30 percent in the next 12 months.

Property investment accounts for about 10 percent of gross domestic product and construction consumes half of the nation’s output of steel and 36 percent of the aluminum that it makes, JPMorgan Chase & Co. estimates.

Jiangxi Copper, China’s biggest producer of the metal, slid 3.1 percent to 24.51 yuan, snapping a five-day, 13 percent rally. Aluminum Corp. of China Ltd. dropped 2.2 percent to 8.94 yuan. Baoshan Iron & Steel Co., the listed unit of China’s second- biggest steelmaker, declined 2.8 percent. Shenhua, the largest coal producer, retreated 2.3 percent to 21.77 yuan.

Copper decreased as much as 0.9 percent in London and aluminum fell 0.6 percent. Crude oil dropped as much as 0.9 percent in New York.

Waste Leak

Zijin Mining Group Co., the country’s largest gold producer, tumbled 3.7 percent to 5.76 yuan. The company said it has suspended stockpiling of ore at the Zijinshan mine after waste water containing acidic copper leaked into a nearby river. The incident has had a “substantial effect” on copper production at the mine, it said.

Royal Bank of Scotland Group Plc said it sees a “buying opportunity” in China’s yuan-denominated shares as equity supply may ease in the second half compared with the first six months of 2010 and as investors become “less concerned” about policy risks.

“It should become apparent in the coming months that Beijing is less concerned about inflation or asset bubbles for the rest of 2010,” RBS analysts led by Wendy Liu wrote in a report yesterday.

Agricultural Bank

Agricultural Bank of China Ltd., which begins trading in Shanghai on July 15 and in Hong Kong the day after, raised $19.2 billion in the world’s biggest initial public offering in four years.

Companies may raise about 500 billion yuan in initial public offerings in Shanghai and Shenzhen this year, more than in any other country, PricewaterhouseCoopers said July 5.

China doesn’t plan to delay or suspend initial share sales in Shanghai or Shenzhen, the China Securities Journal said, citing an unidentified official at the China Securities Regulatory Commission. The comments refute media reports saying China is considering suspending new IPOs to stem further declines in the stock market, it said.

The following companies were among the most active in China’s markets. Stock symbols are in brackets after companies’ names.

GD Power Development Co. (600795 CH), the largest electricity producer in northeastern China, added 1.5 percent to 3.39 yuan. The power producer said its electricity generation in the first half of this year rose 15 percent to 49.3 billion kilowatt hours.

Orient International Enterprise Ltd. (600278 CH) rose by the 10 percent daily limit to 10.01 yuan after the company said it will sell 81.7 million shares to its parent in exchange for garment and logistic businesses valued at 997 million yuan.

Pingdingshan Tianan Coal Mining Co. (601666 CH), the listed unit of China’s fifth-largest producer of the coal, gained 2.8 percent to 14.75 yuan after saying first-half net income increased 44.5 percent from a year earlier to 1.27 billion yuan.

Tiancheng Co. of Taiyuan University of Technology (600392 CH), a manufacturer of electronic equipment, lost 1.8 percent to 17.10 yuan after saying its shareholder Shanxi Hongzhan Guarantee Co. reduced its stake in the company.

Tuesday, July 13, 2010

Trader alert: Oil could be set for a quick move higher

Oil may push toward $84 a barrel based on signals from on a Japanese charting method called Ichimoku Kinko Hyo, or "one-glance cloud chart," according to Astmax Ltd.

Oil''s close of $76.09 a barrel in New York on July 9 has breached the upper edge of the Kumo, or cloud, formation between $75.70 and $73.57 on a daily chart, a sign that prices will rise, said Tetsu Emori, a commodity-fund manager at Astmax in Tokyo. Prices may be limited by the top of $80.21 on the weekly Ichimoku graph.

"Moving above the cloud is a signal for the next upside move," Emori said. "$80 is the top range. Once we get past that we don't see any resistance, so the market could move toward the $84 level."

Ichimoku charts, invented by Japanese journalist Goichi Hosoda, are named after the most recognizable portion of the graph, the cloud that forms in the gap between the Senkou lines. These lines, also called leading spans, are derived from past price highs and lows and plotted out 26 days ahead. They act to identify the resistance and support levels.

Crude for August delivery was at $76.15 a barrel, up 6 cents, in electronic trading on the New York Mercantile Exchange at 11:45 a.m. Singapore time. Earlier it rose as much as 34 cents, or 0.5 percent, to $76.43. Futures has climbed 5.8 percent since trading at a four-week low on July 6.

Besides the prospect of prices moving above the cloud, the Ichimoku chart is showing other signs that oil might rise based on the interaction of two lines on the graph called the Kijun- sen, or base, and the Tankan-sen, or conversion.
The base line is a moving average of the past 26 days' trading and the conversion is from the past nine days.

Conversion Line

The conversion line crossed over the base figure on June 11, considered a bullish sign comparable to the signal line rising above the moving average convergence/divergence indicator on a MACD chart.

A final signal for crude to rise is seen in the Chikou, or lagging span, which shows the closing price projected back 26 days into the past. At $76.09 a barrel, that line is above the June 3 closing price of $74.61.

"In total, three out of four key indicators are bullish, leading us to conclude that the Ichimoku analysis is bullish for" New York oil futures, Schork Group Inc. said a June 29 report.

Monday, July 12, 2010

CHART OF THE WEEK: ONE MORE "ASIA UP, THE WEST NOT SO MUCH" TREND


For our chart of the week, we're taking one more look at the huge "Asia up, the West not so much" trend that will last for decades. The chart shows the amazing strength in Thai stocks.

Thailand is another Asian country without the huge unfunded welfare programs Western Europe and the U.S. face right now. Like its neighbors Singapore and Malaysia, it's a short plane or boat ride away from the giant emerging markets of India and China. When India and China grow, Thailand grows with them.

For much of the past year, the only news coming out of Thailand has been about violent political protests. Over 80 people have died in recent demonstrations. But as you can see from this week's chart of the iShares Thailand Fund (THD), this ugly news has barely budged the uptrend in the country's stock market.

This is extraordinary strength in the face of the global market selloff… and more proof the "rise of Asia" is a key investment trend to monitor. You can read this free interview from our sister site The Daily Crux for some "boots on the ground" Thai stock picks from the legendary Dr. Marc Faber.

Sunday, July 11, 2010

MORE OF THE "ASIA UP, THE WEST NOT SO MUCH" TREND


For another picture of the big "Asia up, the West not so much" trend you need to watch for the next 20 years, we look at Malaysia…

Like Singapore, Malaysia sits in the crossroads of Asian trade. The giant markets of Australia, India, and China are all a short distance away. But unlike Singapore, Malaysia is not a global financial hub. Malaysia is a major producer of natural gas, timber, palm oil, cocoa, and rubber. Manufacturing and tourism are also big drivers there.

Look at the stock chart of Germany, France, Spain, the U.S., England, or Italy and you'll see a bearish series of "lower highs and lower lows." As we saw yesterday, that's not the case with Singapore… and it's not the case with Malaysia…

Below is the past 18 months of price action in the major Malaysian investment fund (EWM). While stocks in the West are taking a beating, this fund is enjoying a bullish series of "higher highs and higher lows" and sits near a yearly high. This is more confirmation that the bloated, socialistic welfare states of the West are losing ground to the hard-working, "can do" savers of the East… a heck of a change from 50 years ago.

Saturday, July 10, 2010

The huge source of power China has over America that no one talks about

China, the world’s largest rare- earths producer, cut export quotas for the minerals needed to make hybrid cars and televisions by 72 percent for the second half, raising the possibility of a trade dispute with the U.S.

Shipments will be capped at 7,976 metric tons, down from 28,417 tons for the same period a year ago, according to data from the Ministry of Commerce yesterday.

Rising production of hybrid cars and music players such as Toyota Motor Corp.’s Prius and Apple Inc.’s iPod have driven up demand for rare earths even as China cut the quotas to shore up prices and ensure domestic supplies. The U.S. is looking at building a trade case on the restrictions, industry representatives said last month.

“The rare earths industry officials have realized that, after many years of continued growth in exports, the industry didn’t receive due profit returns,” Liu Aisheng, director of the Chinese Society of Rare Earth, said in an interview by phone from Beijing. “They adjusted the policy to ensure that the resources are optimally utilized.”

Shares of Lynas Corp., building a rare earth mine in Australia, rose 8.8 percent to close at 59.5 Australian cents in Sydney. Inner Mongolia Baotou Steel Rare-Earth Hi-Tech Co., the biggest Chinese producer, rose 1.4 percent to close at 36.69 yuan on the Shanghai stock exchange.

Baotou Steel, Baotou Huamei RE Products Co. Ltd. and Sinosteel Corp. are among the 32 local and foreign companies that are permitted by the government to export in the second half, according to the Ministry of Commerce statement.

Lynas Opportunity

“The tightening of supply regulations provides additional opportunities for Lynas to meet the supply deficit out of China,” Executive Chairman Nicholas Curtis said today in a statement filed to the Australian Stock Exchange. Sydney-based Lynas is building a rare earth mine at Mount Weld in Australia.

The total Chinese export quota for 2010 is 30,258 tons, 40 percent less than the 50,145 tons for 2009, Lynas said in the statement.

Rare earths are a group of chemically similar metallic elements, including lanthanum, cerium, neodymium and europium. They are used in radar, high-powered magnets, mini hard-drives in laptop computers, catalytic converters for vehicles, electric-car batteries and wind turbines. China, which accounts for more than 90 percent of the global production, started cutting output and exports in 2006 as prices fell.

“Reduced supply from China will trigger other rare earth producers to boost production to fill the gap,” said Liu of the Chinese rare earth society. Still, the policy will force some privately owned Chinese producers to shut down as they are not authorized exporters, he added.

Trade Tensions

The U.S. has asked business groups and unions to provide evidence that China is hoarding rare earths for a case that may be filed at the World Trade Organization, according to industry representatives who asked not to be identified.

A rare-earth mine in the U.S., in Mountain Pass, California, shut down most operations in 2002. Molycorp Inc., which owns the mine, plans to reopen it this year.

China needs to restrict exports and production because domestic supplies won’t be enough to meet its own needs, the Ministry of Industry and Information Technology said in September.

Friday, July 9, 2010

THIS TREND IS GOING TO LAST FOR A LONG, LONG TIME


Today, we look at one of the most amazing uptrends in the market right now. It confirms one of our top long-term investment themes: Get long Asia.

The long-term case for owning Asian assets versus assets in the U.S. and Western Europe is simple. Over the past 40 years, the Western world has cooked up a hellish stew of huge, unfunded entitlement programs, monstrous government debts, and vast populations who've adopted the "something for nothing" way of life. This produces a headwind for stock and property prices.

Asia isn't burdened with parasitic welfare states. Most Asians are poor… but they're working and saving like crazy in order to catch up to the rich Westerners they see on TV and YouTube. This produces a tailwind for stock and property prices.

You can see this uptrend at work with today's chart. It shows the past 18 months of price action in the Singapore investment fund (EWS). As we noted last year, Singapore is one of the great "trophy assets" of Asia. Singapore sits in the center of Asian trade. It's one of the world's top-five financial centers. It's home to the world's largest water port. Most importantly, it's considered the world's easiest place to set up and conduct business.

While stocks of all kinds are suffering through massive selling pressure right now, EWS sits comfortably near a new 52-week high. Expect this "Asia up, the West not so much" trend to continue for decades.

Thursday, July 8, 2010

Jim Rogers: Silver is one of the few safe refuges left

Investors should sell bonds and buy commodities like silver and rice as a “refuge” as the world economy may continue having problems, Jim Rogers, chairman of Rogers Holdings said.

“Bonds are not a good place to invest in,” Rogers said at a conference in Kuala Lumpur today. “You should own commodities because that’s your only refuge” whether it’s silver or rice, said Rogers, who predicted the start of the global commodities rally in 1999.

Gold has gained 8.3 percent this year, leading advances in precious metals, as investors seek haven assets to protect their wealth amid concern the global economic recovery will falter. Still, commodities overall capped their worst quarter in more than a year on investors’ concern that slower growth from China to the U.S. will sap demand.

The best place to be is in commodities and other natural resources, including precious metals like silver, platinum and palladium, said Rogers, who co-founded the Quantum Hedge Fund in 1970. Commodities are good to buy as supply shortages are already developing, the Singapore-based investor said.

Gold prices will rise to more than $2,000 per ounce, said Rogers, without giving a timeframe. Bullion for immediate delivery declined 0.4 percent at $1,187.85 an ounce at 6:34 p.m. in Singapore. It reached a record $1,265.30 on June 21.

‘Straight Up’

“I do own gold,” he said. “Gold has been extremely strong of late, but I’m not rushing out to buy gold. I don’t like to buy things that have been going straight up.”

While gold has been trading at all-time highs, silver remains 60 to 70 percent below its peak and is a better investment, he said. Silver reached an all-time high of $50.35 in New York in 1980.

Silver for immediate delivery fell 1 percent to $17.6413 an ounce at 6:22 p.m. Platinum dropped 0.6 percent to $1,507.68 and palladium declined 1.2 percent to $433.35.

Still, agricultural commodities are better than metals as prices are “very depressed,” he said, pointing to sugar which is 75 percent below its all-time high in 1974. Raw sugar for October delivery slid 1.2 percent to 16.49 cents a pound on ICE Futures U.S. in New York. It reached a record of 66 cents in November 1974.

“Not many things are 75 percent cheaper that 36 years ago, but that’s true of sugar,” Rogers said. “Agriculture commodities are desperately cheap compared to 20, 30, 40 years ago.”

Rice futures on June 30 touched $9.55, the lowest price since October, 2006, on rising production and declining demand. The contract for September delivery gained 0.7 percent to $9.935 per 100 pounds on the Chicago Board of Trade at 6:15 p.m. in Shanghai.

Tuesday, July 6, 2010

Currency trade: Top strategist says euro is headed much lower

The most accurate foreign-exchange forecaster says the euro will continue to weaken and may approach parity with the dollar as the European Central Bank buys more government bonds to support the region’s economy.

Shaun Osborne, chief currency strategist at TD Securities Inc. in Toronto, said the euro will depreciate to $1.13 in the third quarter, $1.08 by year-end and may near $1 in 2011 before recovering. Osborne, whose predictions were within 4.1 percent of the mark on average, according to data compiled by Bloomberg, was echoed by the nine following most-accurate forecasters in anticipating a lower euro in the next two quarters.

The euro weakened 15 percent against the dollar in the first half on speculation record budget deficits from Ireland to Portugal and Greece will force governments to cut spending and reduce economic growth. Bond yields among the euro-area’s so- called peripheral nations surged relative to German bunds even as European Union leaders crafted an almost $1 trillion aid package to avoid sovereign defaults.

“It’s going to be an immensely challenging environment for these economies to try and regain competitiveness internally within the euro zone,” said Osborne, 47, who has been head of currency strategy at TD Securities since he joined in 2006 from Scotia Capital. “The ECB is moving towards its version of quantitative easing. It suggests they’re going to be very late now to the tightening cycle.”

The currency, shared by 16 European nations, rose 0.5 percent to $1.2596 as of 8:45 a.m. in London. It has gained 5.6 percent since hitting a more than four-year low of $1.1877 on June 7, after falling from 2009’s high of $1.5144 on Nov. 25.

Diversifying Reserves

The ECB began buying government bonds from some member nations on May 10, part of the EU rescue package, to cap yields and underpin the euro. The decline threatens to break up the region, former Federal Reserve Chairman Paul Volcker said in May, while central banks are putting more of their reserves into currencies other than the euro, data from the International Monetary Fund show.

“Reserve diversification, one of the drivers behind euro strength ever since the introduction of the single currency, is therefore unlikely to be euro-dollar supportive over the next few years,” said Henrik Gullberg, a strategist in London at Deutsche Bank AG, the world’s biggest foreign-exchange trader and one of the five best predictors of the currency’s decline against the yen and the pound this year.

Most Accurate

TD Securities, a unit of Canada’s second-biggest lender, Toronto-Dominion Bank, was also the most accurate forecaster for the dollar against the yen, second best for the euro versus the yen and the dollar-Swiss franc exchange rate. The firm’s predictions had the lowest margin of error in a survey of 48 forecasters of eight currency pairs in the past 18 months.

The firm surpassed second-ranked Standard Chartered Plc, whose margin of error was 4.37 percent, third-place Wells Fargo & Co., Credit Suisse Group AG in fourth place and Canadian Imperial Bank of Commerce in fifth.

Recent euro strength is a sign traders are trimming bearish bets after wagering correctly that the currency would weaken, rather than a change in sentiment, according to Callum Henderson, head of foreign-exchange strategy at Standard Chartered in Singapore.

Fiscal Tightening

“We do not think euro-dollar weakness is over,” Henderson wrote in an e-mail. “Growth in the euro area will remain subdued for some time due to fiscal tightening. To be sure, euro weakness will benefit the exporters in north Europe.”

Henderson predicts a drop to $1.10 to $1.12 this quarter, before the euro recovers to $1.30 by 2012.

CIBC, based in Toronto, predicts the euro will depreciate to $1.18 in the third quarter, before climbing to $1.20 by the end of the year and $1.24 by mid-2011. The next six months will be a “turning point” as traders focus on economic frailty in the U.S., said Avery Shenfeld, the chief economist at CIBC. The Toronto-based firm’s average margin of error was 5.19 percent.

Futures show a majority of traders don’t expect an interest-rate increase by the Fed until the second quarter of 2011 after the central bank said June 23 that “financial conditions have become less supportive of economic growth on balance, largely reflecting developments abroad.”

“There will be an absence of enough growth to prompt Fed tightening anytime soon, and a recognition that if domestic demand cannot sustain the U.S. expansion that a weaker dollar will be needed to allow trade to fill in for some of that,” said Shenfeld, who joined CIBC 16 years ago and has been chief economist for a little more than a year.

Rate Differentials

The Fed has kept its benchmark interest rate at zero to 0.25 percent since December 2008, while the ECB’s main rate has been at a record low of 1 percent since May 2009.

The most accurate analysts were identified using data gathered for Bloomberg’s Foreign Exchange Forecasts function.

Firms were compared based on seven predictions: six forecasts as of the end of each quarter for the close of the subsequent quarter, starting Dec. 31, 2008, plus estimates as of a year ago for this year’s second quarter. Only firms with at least four forecasts were ranked in each currency pair, and only those that qualified for ranking in at least five of eight pairs were included in the overall best list.

The majority of analysts say the euro has further to fall against the dollar, dropping to $1.19 in the first quarter and ending 2011 at $1.21, according to the median of at least 26 forecasts compiled by Bloomberg.

Weakness ‘To Persist’

“Over the next six months, the market’s concern over the growth outlook is likely to persist,” said Derek Halpenny, European head of global currency research in London at Bank of Tokyo-Mitsubishi UFJ Ltd., which ranked seventh overall, with a 5.55 percent margin of error. “The scenario for the global economy is deteriorating, and in those circumstances you’ve got to prefer the dollar over countries where they are implementing austerity programs.”

The euro is most likely to weaken in the second half of this year against the Australian, New Zealand and Canadian dollars, said Nick Bennenbroek, 39, global head of currency strategy in New York at Wells Fargo, the biggest U.S. home lender. The bank had a margin of error of 4.76 percent across all currency pairs and was the top forecaster for the dollar against the yuan.

‘Continue to Weaken’

“Our overall view is that the euro will continue to weaken and Australia, New Zealand and Canada will rebound over the next year,” said Bennenbroek, who joined the bank in 2007, beginning his career in finance at the New Zealand Treasury in Wellington. “These are medium-term trades we believe people should be putting on now.” The euro will end this year at $1.20 and conclude 2011 at $1.08, he said.

Currency forecasting became easier the past 12 months after the worst of the global financial crisis, sparked by Lehman Brothers Holdings Inc.’s collapse in September 2008, passed, said Niels Christensen, 49, chief currency analyst at Nordea Bank AB in Copenhagen. Nordea was the most-accurate forecaster for the euro-dollar exchange rate.

“In March 2009, everybody was wondering whether we would get another Lehman, that the economy was extremely fragile,” he said. “In December 2009, the wave of risk appetite was abating and currencies started to trade on fundamentals and rate differentials again.”

The euro will trade at $1.25 through year-end before weakening to as low as $1.15 in 2011, according to Nordea.

Ray Farris, head of foreign-exchange strategy in London at Credit Suisse, whose margin of error in the survey was 4.81 percent, said he wasn’t able to immediately comment.

The European currency will rise versus the yen, climbing to 114 yen in the fourth quarter and 127 yen by the end of 2011, from 109.36 today, median forecasts show. The pound will fall to $1.44 this quarter, and strengthen to 81 pence per euro in the first quarter, the estimates show. Sterling was at $1.5202 and at 82.85 pence per euro today.

Monday, July 5, 2010

Bears beware: The market could see a sharp rally soon

I'm going to go through some signs that rabid bears might do well to pay attention to because I think the market is very close to a major bottom.

... We can probably expect an explosive rally soon, even if it ultimately turns out to be a counter trend rally in an ongoing bear market.

First, way too many people are counting on the head and shoulders pattern taking the market directly down to 850. Folks, historically these head and shoulder patterns have a success rate of about...

Sunday, July 4, 2010

This is the world's most affordable retirement haven

You may not have heard of Cuenca, Ecuador, but if you're looking to retire overseas you'll want to learn more.

It's been named the top city in the world to live well on a budget by U.S News and World Report. Sure there are places that are cheaper, but this piece says no other cities offer the same combination of lifestyle and low cost of living.

The article details how individuals can live well for less than $850 a month.

Saturday, July 3, 2010

CHART OF THE WEEK: TAKING THE "LONG VIEW" OF GOLD


Now that gold has soared from $925 an ounce to $1,200, it's amazing how many people CNBC trots out to explain every random $20 move in the metal.

We hope by now all DailyWealth readers realize trying to analyze every move in the gold price is a waste of time. We don't see gold as an investment. We see it as real-money "crisis insurance." We bought our gold long ago… and we hope to never have to use it. Not much more "analysis" is needed here.

We also encourage folks to take the "long view" when taking stock of their gold holdings. This long view – a 10-year chart of gold – is our chart of the week.

Gold began its uptrend in 2002. Since then, it has climbed higher every single year… and now sports one of the smoothest long-term uptrends in history. You'll also notice the long-term trendline we've drawn in blue. As you can see, gold could fall all the way down to $900 an ounce and remain within the confines of its uptrend. Keep this sensible view in mind when listening to the ridiculous short-term-focused commentary that goes for "analysis" these days.

THE MONEY MARKET

FRIENDS