Pages

Showing posts with label Stock Markets 2010. Show all posts

Sunday, August 22, 2010

Make 10 Times Your Money without Taking Big Risks

Investing is like tennis. It's a loser's game.

Think of the difference between professional and amateur tennis players. Professionals win points. Amateurs lose them. When weekend warriors play tennis, the losers determine who wins. They hit the ball into the net. They whack it out of bounds. And they routinely double-fault on their serves. That doesn't happen nearly as much in pro tennis, with its long rallies and pinpoint shots.

Most investors are like amateur tennis players. They lose money in stocks because of their own behavior. There's no opponent outplaying them. They beat themselves.

DALBAR, a Boston-based research firm, compared the returns from market index funds with returns real investors earned in equity mutual funds…

From 1989 to 2009, market index funds returned 8.3% per year. If you compound $10,000 at that rate for 20 years, you'll wind up with just under $50,000 – five times your money. For buying an index fund and doing nothing else, that's a great return. No research necessary. No thinking required. Just buy and wait. It couldn't be easier, and you get five times your money, pretax.

The only problem with that 20-year, five-times-your-money return is that almost nobody earned it.

Real, flesh-and-blood investors investing their own real, hard-earned money made significantly less than 8.3% per year over that time. On average, individual investors in U.S. equity funds earned just 3.3% per year. At that rate, $10,000 grew to just $19,150 in 20 years. They didn't even double their money – in 20 years! Most investors just can't hit the ball back over the net.

Most real investors investing their own real money perform even worse relative to the overall market in bull markets. During the great bull market to end all bull markets from 1984 to 2000, DALBAR found equity mutual fund investors made 2.57% per year, with market index funds compounding at 12.22% per year.

The age of the daytrader treated investors worse than most periods. Investors ran around the court faster than ever, swinging like mad, only to hit more balls out of bounds and into the net than ever, turning a $10,000 investment into just $15,000 during the biggest bull market in history. Had they simply failed to lose, they'd have turned $10,000 into just over $100,000.

Investors could have made 10 times their money in 16 years by refusing to overmanage their own money – by letting stocks do the work for them.

A large dose of humility would help most investors make more money in stocks. For starters, most investors just shouldn't buy individual stocks. They should buy index funds and plan to hold for decades. Almost everyone else should build a diversified portfolio of only the highest-quality names and plan to hold them for at least 10 years.

If you can't hold on for a long time, be prepared to take losses.

In my Extreme Value newsletter, I have a list of the world's best companies that are currently trading at absurdly cheap prices. I've mentioned a few here before: Microsoft (MSFT) and ExxonMobil (XOM) are two of my favorites.

These and stocks like them are an excellent start on a diversified portfolio that could earn you 10 times your money – remember, that's 12.22% per year for 16 years. Most stocks like this will compound your money at single-digit rates. But one or two could produce enormous returns.

You don't need to take on big risks to earn that kind of return. All you need to do is wait. To master the loser's game, you must be patient. You must master time itself.

Thursday, August 19, 2010

A "MARKET-APPROVED" SHORT SALE


A special note for traders out there: One of Porter Stansberry's favorite "short sale" candidates is breaking down…

In today's age of government bailouts and boondoggles, we encourage trading-oriented readers to become familiar with the concept of short selling. A "short sale" is a trade that allows you to profit as a stock decreases in price, rather than as it increases in price. Few analysts are as skilled at finding these "headed lower" stocks than our colleague Porter Stansberry.

In just the past few years, Porter has nailed the bankruptcy of General Motors, Freddie Mac, and Fannie Mae. Porter targets businesses with declining revenues, obsolete business models, and big debt loads – businesses like USA Today publisher Gannett (GCI). Porter notes the newspaper publisher competes in a low-margin business that is suffering declining revenues… all the while trying to service a huge debt load.

As you can see from today's chart, the market likes Porter's thesis. After surging 800% off its March 2009 panic bottom, Gannett now sports the chart of a rocket that has run out of fuel. The stock has sputtered from $18 per share to $13 in the past four months. It just broke down to its lowest low in six months on massive selling volume. Trend followers, here's one to play on the downside…

Wednesday, August 18, 2010

Emerging markets guru Mobius: Global recovery is leaving the U.S. behind

The global economic recovery is "well in place" and may accelerate as growth in developing nations counters a slowing pickup in Japan and the U.S., according to Templeton Asset Management Ltd.'s Mark Mobius.

The so-called BRIC markets of Brazil, Russia, India, and China, as well as Turkey and South Africa, will drive the recovery, said Mobius, who predicted the bull-market rally in emerging markets in March 2009. The MSCI index of 21 developing nations has doubled since it bottomed out in March 2, 2009.

Goldman Sachs Group Inc. and Pacific Investment Management Co. Chief Executive Officer Mohamed A. El-Erian said this month there's at least a 25 percent chance of the U.S. falling back into a recession, while the Federal Reserve flagged a weaker- than-anticipated recovery in the U.S. Mobius said increasing liquidity will help shield developed economies including the U.S. from a so-called double-dip recession.

"That's the U.S., but the rest of the world is moving in a different direction," Mobius, who oversees about $34 billion as Singapore-based executive chairman of Templeton's emerging markets group, said in a Bloomberg Television interview. "Going forward, the numbers will get better and better."

Japan's gross domestic product expanded an annualized 0.4 percent in the three months ended June 30, while the U.S. economy grew at a slower-than-estimated 2.4 percent annual pace, data released this month showed. While China's growth slowed to 10.3 percent during the quarter from 11.9 percent in the January-March period, that was enough to help the economy overtake Japan as the world's second-largest.

'Not Too Bad'

"Even if we see a slowdown in China from 10 percent to 8 percent, that's not too bad," Mobius said. "If it goes to 5 percent, we'll get worried."

The stronger recovery in emerging economies has helped stock markets outperform those in developed nations. The MSCI Emerging Markets Index rose 0.3 percent as of 2:05 p.m. in Singapore, trimming its losses this year to 0.1 percent. The MSCI World Index was up 0.1 percent after having slumped 5.3 percent in 2010.

"Given that there won't be a double dip, we still think that there will be a continuing bull market," Mobius said. "Valuations are not as reasonable as they were at the beginning of 2009 and at the end of 2008. We can find opportunities, but they're not as easy."

In China, Templeton Asset Management is "selectively" seeking out consumer and manufacturing stocks as corporate earnings benefit from a shift in the economy's dependence on exports to domestic spending, according to Mobius. He's "not too interested" in the nation's banks, citing the prospect of an increase of as much as 20 percent in non-performing loans.

Brazil remains his top pick among developing nations, he said, citing the nation's natural resources and a shrinking income gap. He favors the nation's banks and raw material producers including Vale SA, the world's third-biggest mining company.

Tuesday, August 17, 2010

A CLASSIC PETER LYNCH WINNER


Our chart of the week displays that, in addition to tobacco companies, another business has shrugged off the recent market weakness and terrible job numbers.

That business is home movie rentals. Specifically, home movie rentals from Netflix (NFLX).

Netflix strikes us as a classic "Peter Lynch stock." The phenomenally successful money manager Lynch became famous for his love of investing in companies that earned the loyalty of friends and family. These days, most people we know are huge fans of Netflix and its easy-to-use red envelopes. We count ourselves as users. Ordering The Good, the Bad, and the Ugly online beats standing beside a smelly guy at Blockbuster.

As you can see from our chart of the week, this easy-to-use business is soaring right now. Revenue for the most recent quarter rose 27% from the same time period one year ago. The stock is up from $40 per share last summer to $130 today… and it's one of the few stocks able to strike a new 52-week high amid this week's huge selling pressure.

Monday, August 16, 2010

IT'S STILL A BULL MARKET IN CIGARETTES


Despite weak job numbers, weak earnings, and recent stock market weakness, today's chart says it's still a bull market in cigarettes.

We often poke fun at faddish investment ideas like solar and wind stocks. Instead of chasing these ideas, we say focus long-term investment in dominant businesses with fat profit margins and excellent brand names. Focus on stocks like the world's biggest cigarette maker, Altria (MO).

We've written bullishly about cigarette comanies many times in DailyWealth (check out a few pieces here and here). While it's easy to understand Marlboro's incredible brand power, most people don't understand the government loves it when folks buy Altria cigarettes. The government is even more addicted to the huge taxes it collects from Altria than Altria's customers are addicted to its product.

This addiction produces the chart you see below… the past 12-month's action in Altria shares. While stocks around the world have sold off in the past week, Altria has climbed to a new 52-week high, all the while kicking off huge dividend payments.

Sunday, August 15, 2010

THE BIG MONEY IS STILL SELLING


Some of that big money we've been monitoring for the past few months returned yesterday… to sell.

The stock market enjoyed a 10% rally from early July to early August. But during the rally, there was little buying enthusiasm from huge institutional investors like mutual funds, pension funds, and insurance funds. A healthy bull market can only take place with strong buying interest from these mega players.

Below, we look at the recent price and volume action in the benchmark S&P 500. As you can see, the S&P suffered several high-volume selling periods in May and June (A). The subsequent July rally was marked by tepid buying volume (B).

Now note the past few days of negative action, which came on stronger volume (C). The index also sliced through its 200-day moving average… a "line in the sand" many investors use to demarcate bull and bear markets.

Although we're eternal optimists here at DailyWealth, we can only interpret this "weak buying, strong selling" trend as bearish action. We'll need to see a big money buying rally before we change our view…

Thursday, August 12, 2010

THE BIG MONEY ISN'T BUYING THIS RALLY


To recap, a healthy bull market is driven by the buying power of mutual funds, hedge funds, and insurance company funds. These investors control multibillion-dollar portfolios. Only with strong buying enthusiasm from these folks can a real bull market flourish. Today's chart shows anything but enthusiasm…

Our chart displays the past six months of trading in the Dow Industrials investment fund (DIA). This is a basket of America's biggest, most important companies. Below the price chart, you'll find a window displaying the fund's daily trading volume. The red bars represent trading volume on days the fund declined. The gray bars represent trading volume on days the fund advanced. The taller the bar, the greater the volume.

As you can see below, trading volume boomed during the May selloff (A)… and selling power remained strong through the final tough days of June (B). Now note how the recent rally has come on tepid volume (C). Some of this "where's the big money?" action can be attributed to money managers taking their summer vacations. But even taking vacations into account, this is a bearish lack of buying interest.

Saturday, August 7, 2010

EXXONMOBIL'S BIG COMEBACK


Nearly everywhere we look, we see huge amounts of money flowing back into "good time" trades.

During May and June, stock sectors that depend on a robust global economy – "good times" – took major hits to their asset values. They included home improvement giant Home Depot (home spending), base-metal miners (manufacturing and infrastructure spending), and transportation stocks (the shipping of goods).

Among the selloffs we found most worrisome, however, was America's largest public company, ExxonMobil (XOM). XOM is one of the best managed businesses in the world… and it's considered one of the world's most stable, most solid companies. In May and June, the stock sold off heavily. If folks can't stand the thought of owning XOM, it's a terrible sign for the overall market.

As you can see from today's chart, XOM suffered a decline from $68 per share to below $57… a huge move for such a large company ($320 billion market cap). But like many assets, shares have enjoyed a major rebound in the past few weeks… and have climbed back north of $62. Put this action in the "good news and good times" column.

Wednesday, August 4, 2010

A HUGE BEAR MARKET IS ENDING


This week brings good price action for uranium bulls like our colleagues Marin Katusa, Chris Mayer, and Matt Badiali…

The bull case for uranium – the chief fuel for nuclear reactors – is that "emerging" Asian nations are embarking on a building spree of nuclear plants to meet a portion of their growing electric needs. Meanwhile, new supply is unlikely to rise in lockstep with all this new demand.

These factors produced a more than 10-fold rise in uranium from 2003 to 2007… The end of that rally was fueled by speculators, who helped produce a subsequent crash. This crash hammered uranium prices and the companies associated with the stuff. But as you can see from today's chart of Uranium Participation Corp, uranium investment is getting a little "less bad" these days.

Uranium Participation Corp is no mining or exploration company. It's simply an investment vehicle that hoards uranium and acts like an exchange-traded fund for the stuff. The stock has been locked in a major downtrend over the past few years. But over the past few weeks, it has broken out of this downtrend. It's no sure indicator the bear market in uranium is over, but it's a step in the right direction…

Friday, July 30, 2010

THE GREAT CIGARETTE DIVIDEND MACHINE HEADS HIGHER


Last week, we heaped abuse on the "perfectly hedged" clean energy fund. This kind of investment somehow manages to lose money in both good times and bad.

This week, we take a look at the antidote to faddish ideas like solar and wind energy: We look at the past year's price action in Altria (MO).

Altria is the world's dominant cigarette maker. It's a stock Dan Ferris and Tom Dyson have written bullishly about in DailyWealth (check out their arguments here and here). While it's easy to understand Marlboro's incredible brand power, most people don't understand the government loves it when folks buy Altria cigarettes. The government is even more addicted to the huge taxes it collects from Altria than Altria's customers are addicted to its product.

As you can see from our chart below, the cigarette business is doing well these days. Altria just struck a new 52-week high. Despite this price gain, the stock still yields over 6%. This chart proves that when it comes to making long-term investments, there's no need to chase the "next big thing"… just stick with the incredible cash flow and dividend-producing power of "World Dominators" like Altria.

Thursday, July 29, 2010

CHART OF THE WEEK: GOLD AND APPLE – A GOOD PAIR


This week's chart is a tale of two "crisis-beating" assets. Gold and Apple.

In the past three years, just about every asset you can think of has either lost money or treaded water. The 2008 credit-crisis selloff was so severe, even recent rallies haven't been able to carry assets back to their levels of a few years ago. Two exceptions here are gold and shares of Apple.

Below is what's called a "performance chart." Performance charts graph the percentage returns of assets against each other. In this case, it's the past three years of gold (gold line) and Apple shares (blue line).

Amazingly, both assets have registered the same gains since mid-2007… around 80%. Gold is enjoying price strength because of its role as "real money" crisis insurance. Apple is enjoying brand dominance in phones and music players. It's a heck of a "pairs trade."

Wednesday, July 28, 2010

THE CLEAN ENERGY FUND? YES, STILL PERFECTLY HEDGED


Today, we take another look at one of most perfectly hedged investment funds on the market: The big "clean energy" fund, PBW.

DailyWealth readers know we believe long-term investors should focus on boring, dividend-producing businesses like Altria and Johnson & Johnson. The investor is best served by stable, dividend-paying businesses that produce "never go out of style" products like cigarettes and Band-Aids.

Yet many investors are enamored with the idea of investing in clean energy companies… most of which sport such terrible business models that we like to call them "perfectly hedged." They lose money in both good economic times and bad economic times. Their share prices are able to sink in both bull markets and bear markets.

For a picture of this hedged condition, we present the past two years of trading in the PBW. As an easy, "one click" way to go long solar, wind, and various other clean-energy companies, this fund has drawn in hundreds of millions of investor dollars over the past few years.

As you can see from today's chart, this fund managed to get smashed during the 2008 asset selloff. It also managed to not rise during the great 2009 rally… And it continues to tread water. Our advice remains: Ditch the money-losing fad stocks and get into businesses that churn out profits even when the sun is down or the wind isn't blowing.

Tuesday, July 27, 2010

IT'S A BEAR MARKET IN NANOTECH


Around twice a year, we check in with shares of a small company called Harris & Harris. It lets us monitor one of the biggest potential uptrends in the world: nanotechnology.

Nanotechnology is the science of manipulating matter on an extremely small scale… as small as an atom. It holds the extraordinary promise of turning lumps of coal into diamonds… building tiny machines that can clear out blood vessels… or turning toxic waste spills into pristine lakes. As investment "stories" go, nanotech is about as good as it gets.

Harris & Harris is one of the few pure stock plays on the nanotech story. H&H doesn't make nanowidgets or provide nanoservices. It simply funds start-up nanotech companies. The imaginatively named Nanosys and NanoGram are among its investment holdings. H&H even has the ticker "TINY." Thus, TINY rises and falls with how well the nanotechnology story is translating into real investment gains.

As you can see from today's chart, the nanotech story is in a bear market right now. Harris & Harris is down 31% in the past three months and just struck a new 52-week low. Folks aren't interested in paying up for nanotech innovation these days. We're sure this story will eventually be on the pages of every financial magazine you can think of, but for now, it's rough going for nanotech.

Monday, July 26, 2010

ONE OF THE MARKET'S "MUST WATCH" INVESTMENTS


It's back to moving sideways for U.S. banking stocks.

This past March, we profiled the long, sideways trading pattern in XLF. This fund is a basket of the largest financial companies in America. Major holdings include JPMorgan, Goldman Sachs, Wells Fargo, American Express, and Bank of America. These are the companies that rise and fall with America's ability to earn money, invest money, service debts, and launch new businesses.

Last year, XLF enjoyed a huge rebound off its credit-panic lows. But in October, the uptrend faltered… and turned into a long period of sideways trading action. Several months ago, XLF rallied out of this sideways pattern. But as you can see from today's chart, that rally soon gave way to weakness that took XLF back to sideways.

We recommend keeping an eye on this big $13-$15 channel… and on the direction XLF breaks out. As we said, XLF's constituents are the backbone of our banking and credit system… so its share price is a good clue to what's really happening in the economy, no matter what politicians or CNBC commentators blather on about. Money talks and you-know-what walks. You can listen in with XLF.

Saturday, July 24, 2010

THE BIG MONEY IS SELLING, NOT BUYING


The message of today's Market Notes: The "big money" needs to show up… and it needs to show up soon.

A healthy bull market is driven by the huge buying power held by mutual funds, hedge funds, pension funds, and insurance company funds. These investors control multibillion-dollar portfolios… they are the "elephants" of the stock market. Even a private investor with $10 million is a mouse by comparison. Only with strong and ongoing buying enthusiasm from the elephants can stocks climb higher. Now, here's where it gets worrisome…

Today's chart shows the past six months of trading in the Dow Industrials investment fund (DIA). This is a basket of America's biggest, most important companies. Below the price chart, you'll find a window displaying the fund's daily trading volume. The red bars represent trading volume on days the fund declined. The gray bars represent trading volume on days the fund advanced. The taller the bar, the greater the volume. Monitoring trading volume is how we track the elephants.

As you can see, the period of advancing prices during March and April was marked by "ho hum" trading volume (A). May's big selloff was marked by huge trading volume (B). Investors were dumping stocks with much greater enthusiasm than they were buying them. Now notice that each rally since has come on weak volume (C)… while each decline came on higher volume (D). This is a troubling lack of interest from "big money" investors. This "weak buying volume, strong selling volume" trend needs to change if stocks are to rally into year end.

Friday, July 23, 2010

How to Make a Safe 7% Interest in a 0% Interest World


The economy is moving back into recession…

John Hussman, the highly respected manager of Hussman Funds, has built a recession warning system from four financial indicators. He calls this system his "Recession Warning Composite."

Over the last 50 years, Hussman's warning system has a perfect record of predicting recessions. It's never flashed a faulty signal… and it's never failed to flash before a recession.

Right now, Hussman's indicator is NOT flashing recession… but it's on the verge of giving the signal. It'll likely flash in the next few weeks.

"The U.S. economy is most probably either in, or immediately entering, a second phase of contraction," Hussman concludes. (You can read Hussman's commentaries here.)

From my desk, it looks like a combination of the largest government stimulus in history, businesses restocking their inventories, and millions of homeowners getting to live rent-free while their homes are in foreclosure caused a brief 18-month relapse from the recession that started in 2007. Now, the government has pulled back its stimulus, businesses are fully stocked, and evicted homeowners have to pay rent again… And the economy is rolling over.

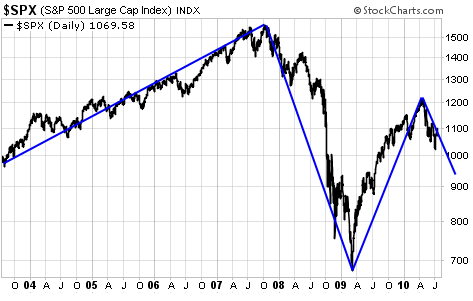
The stock market is anticipating these developments. It's already down 10% from its highs three months ago… and although it bounced back last week, one glance at a long-term chart of the S&P 500 tells you everything you need to know. This market is trending down again:

This is bad news for income investors. In a falling stock market, all the best income investments – like real estate investment trusts (REITs) and master limited partnerships (MLPs) – are no-go areas. Worst of all, the Fed won't raise interest rates while the economy is weak. This leaves us with interest-free bank accounts and 1% CDs.

Finding solid income investments in an environment of zero percent interest rates, a recession, and a falling stock market is not possible for most investors. It's simply a terrible time to be an income investor.

What should you do? I recommend you start looking at bonds…

Bonds have two big advantages over stocks. First, they're safer. When you buy a bond, you're lending money to a company. The company has a legal obligation to return your money in full, with interest. With stocks, there's no such guarantee. Your money is in the hands of the market and anything could happen. Second, bonds pay higher income rates than stocks.

The trick to buying bonds in a recession is to only buy bonds issued by rock-solid companies that have no possibility of going broke. I look for companies with huge cash balances and low debt. When a company has more cash than debt, it's not going to go broke.

Then, I look for high yields. In this market, you should be happy anytime you find a "safe" bond paying over 5%.

Where can you buy bonds? Your broker is one option. Most bonds aren't publicly traded, but your broker may have a selection of bonds in inventory for you to choose from. Your broker might also be able to get bonds from other brokers. Call them up and ask to speak to a fixed-income trader.

Buying bonds on the stock market is my favorite option. Most people don't know this, but over 1,000 bonds and other fixed-income investments trade on the stock market, just like regular stocks. They have common ticker symbols, and you can buy and sell them anytime you want through any discount broker.

Right now, in my 12% Letter portfolio, we have nine of these "stock-market bonds." They're currently yielding an average 7%. And we're guaranteed to get our principal back.

It's hard to find information on "stock market bonds," but one website does a great job. QuantumOnline lets you look at complete lists of all the different stock-market-traded fixed-income investments, including preferred stocks, trust preferreds, bonds, and convertible bonds.

You can even put a stock symbol into its quote box and it'll tell you if that company has any related fixed-income securities trading on the stock market. (Look for the "related securities" link.) QuantumOnline is free, but you'll need to register a username and password before you can use it.

If you're tired of collecting 0% or 1% on your cash, I suggest you get started building a portfolio of bonds today.

Tuesday, July 20, 2010

Stocks Haven't Been This Cheap in Over 20 Years

I have friends and family invested in the ideas I write about in my advisories.

So, when I see someone, the conversation usually turns to stocks. You know how most people comment on the weather in some way early in a conversation. With me, it's the market people want to talk about first.

With the recent market swoon, I've had some folks ask if they should even be in stocks at all. Some 42% of individual investors are bearish and only 25% are bullish, according to a recent American Association of Individual Investors poll.

Newspapers and the like often cite this poll. It's a useful contrarian indicator. When people are bullish, look out. When people are bearish, then perhaps it's a good time to think about buying. Right now, the poll says you should look to buy.

I think most investors are fearful because they focus on the drumbeat of bad economic news. There is a lot of angst over the latest employment numbers, or the manufacturing index, or whatever.

But here is the thing: None of this really has much to do with investing. A lousy economy can be a great place to invest. And an economy in great health can be a terrible place to invest. It all depends on prices. All the noshing on economic data doesn't mean much without some context. You need to know what you get for what you pay.

On that front, things don't look so bad. As Barron's reports, "The forward P/E on the S&P Index is below 12, the lowest since the late 1980s." Unless profits collapse, the market overall does not look expensive. Many of the big stocks in the S&P 500 trade for 10-12 times their 2010 earnings estimate.

Some of them are cheaper than they appear because they have so much cash. Companies like Microsoft and Cisco have $4 per share (about 20% of their market caps) in net cash. If you net out the extra cash, the price-to-earnings ratios fall even further.

Keep in mind, profits have already collapsed. So while profits are growing now, they are still way below pre-recession levels. We're working off a low base.

Beyond this, I think a lot of how you feel about investing comes down to time horizon. I feel pretty good about recommending the stocks in my advisories right now. There are plenty of great opportunities out there if you dig around for them. But I don't know if they'll work in the next three months. I think long term.

I'll quote value investor Clement Fitzpatrick (in Barron's), who gets it exactly right when he says, "It all depends on one's time horizon. Investors who look six months into the future don't behave the same as those who look five years into the future. They come to radically different conclusions."

The market is extremely short-term focused. So you can get an edge if you think out even a year from now.

But let me be clear about something: I don't think the U.S. economy is in good shape. I am most discouraged when I consider the bloated and out-of-control federal and state governments. They spend too much. They are in too much debt. They are far too powerful. And I think it is fair to say that the current administration is hostile to business. I think the U.S. dollar is a sick currency.

This is why I've been investing in overseas themes and ideas. There is a lot of exciting activity in pockets around the world. There is, for instance, a growing new pool of consumers, particularly in Asia, but also Latin America and other developing countries.

There are great opportunities, too, in necessities and scarcity – in things like food and energy and water. I like resource companies – loaded with such things as uranium or potash – and their ability to create wealth.

All this is to say I am not discouraged by the stiff correction from the April highs. I'm still recommending stocks. It's not a popular idea right now… which why I'm confident it's a good one.

Monday, July 12, 2010

CHART OF THE WEEK: ONE MORE "ASIA UP, THE WEST NOT SO MUCH" TREND


For our chart of the week, we're taking one more look at the huge "Asia up, the West not so much" trend that will last for decades. The chart shows the amazing strength in Thai stocks.

Thailand is another Asian country without the huge unfunded welfare programs Western Europe and the U.S. face right now. Like its neighbors Singapore and Malaysia, it's a short plane or boat ride away from the giant emerging markets of India and China. When India and China grow, Thailand grows with them.

For much of the past year, the only news coming out of Thailand has been about violent political protests. Over 80 people have died in recent demonstrations. But as you can see from this week's chart of the iShares Thailand Fund (THD), this ugly news has barely budged the uptrend in the country's stock market.

This is extraordinary strength in the face of the global market selloff… and more proof the "rise of Asia" is a key investment trend to monitor. You can read this free interview from our sister site The Daily Crux for some "boots on the ground" Thai stock picks from the legendary Dr. Marc Faber.

Sunday, July 11, 2010

MORE OF THE "ASIA UP, THE WEST NOT SO MUCH" TREND


For another picture of the big "Asia up, the West not so much" trend you need to watch for the next 20 years, we look at Malaysia…

Like Singapore, Malaysia sits in the crossroads of Asian trade. The giant markets of Australia, India, and China are all a short distance away. But unlike Singapore, Malaysia is not a global financial hub. Malaysia is a major producer of natural gas, timber, palm oil, cocoa, and rubber. Manufacturing and tourism are also big drivers there.

Look at the stock chart of Germany, France, Spain, the U.S., England, or Italy and you'll see a bearish series of "lower highs and lower lows." As we saw yesterday, that's not the case with Singapore… and it's not the case with Malaysia…

Below is the past 18 months of price action in the major Malaysian investment fund (EWM). While stocks in the West are taking a beating, this fund is enjoying a bullish series of "higher highs and higher lows" and sits near a yearly high. This is more confirmation that the bloated, socialistic welfare states of the West are losing ground to the hard-working, "can do" savers of the East… a heck of a change from 50 years ago.

Friday, July 9, 2010

THIS TREND IS GOING TO LAST FOR A LONG, LONG TIME


Today, we look at one of the most amazing uptrends in the market right now. It confirms one of our top long-term investment themes: Get long Asia.

The long-term case for owning Asian assets versus assets in the U.S. and Western Europe is simple. Over the past 40 years, the Western world has cooked up a hellish stew of huge, unfunded entitlement programs, monstrous government debts, and vast populations who've adopted the "something for nothing" way of life. This produces a headwind for stock and property prices.

Asia isn't burdened with parasitic welfare states. Most Asians are poor… but they're working and saving like crazy in order to catch up to the rich Westerners they see on TV and YouTube. This produces a tailwind for stock and property prices.

You can see this uptrend at work with today's chart. It shows the past 18 months of price action in the Singapore investment fund (EWS). As we noted last year, Singapore is one of the great "trophy assets" of Asia. Singapore sits in the center of Asian trade. It's one of the world's top-five financial centers. It's home to the world's largest water port. Most importantly, it's considered the world's easiest place to set up and conduct business.

While stocks of all kinds are suffering through massive selling pressure right now, EWS sits comfortably near a new 52-week high. Expect this "Asia up, the West not so much" trend to continue for decades.

THE MONEY MARKET

FRIENDS