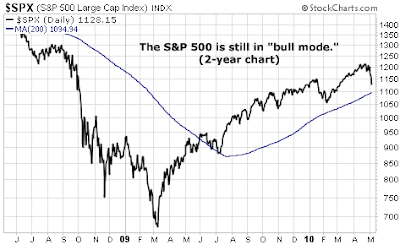
With the euro moving toward "toilet paper" status, stocks plunging, and volatility surging, now is a good time to step back and look at the "big picture." We'll use a "moving average" to do it.
A moving average works by collecting a bundle of an asset's closing prices, say each one from the past 200 days, then taking the average of those prices. This produces a chart line that "smoothes" out market volatility so we can gauge the general trend. When a market is trading above its moving average, it's considered to be in a bull trend. When a market is trading below its moving average, it's considered to be in a bear trend.
One of Wall Street's most widely followed moving averages is the 200-day moving average on the benchmark S&P 500 index. There's nothing magical about the 200-day moving average. It's simply popular because it's popular.
As you can see from the chart below, the S&P has spent the bulk of the past year in a bull trend. And while the index has suffered huge selling pressure in the past few weeks… and was hammered yesterday… on a closing basis, the index has not violated this key level (around 1,100). Stock market bulls need it to hold.

No comments:
Post a Comment